
Understand MQTT traffic through four Trace views
Choose Grid for exact packets, Stream for value changes, Topics for traffic structure, and Sparkplug for reconstructed sessions.
- Author:
- Mqttable
- Updated:
On this page10 sections
Loading...
Choose Grid for exact packets, Stream for value changes, Topics for traffic structure, and Sparkplug for reconstructed sessions.
Loading...
When an MQTT system behaves unexpectedly, the first challenge is knowing where to look. Mqttable Trace turns live MQTT traffic into four focused views, helping you inspect individual packets, follow changing values, understand topic activity, and debug Sparkplug sessions. This chapter explains what each view reveals and how to choose the right one for your question.
Each Trace view is designed to answer a different question about your MQTT traffic. Use Grid to inspect individual packets, Stream to follow numeric values over time, Topics to understand where traffic is flowing, and Sparkplug to examine nodes, devices, metrics, and sessions.
| Start with | Best question | What only this view adds |
|---|---|---|
| Grid | What exact MQTT packets did this client send or receive? | Row-level packet fields and Message Details |
| Stream | Which numeric value changed, when, and by how much? | Time series plus adjacent Payload Diff for one client |
| Topics | How is the loaded traffic distributed across the Topic namespace? | Topic groups, counts, and expandable original rows |
| Sparkplug | What node, device, metric, and session state can be reconstructed? | Sparkplug-aware sessions, inventory, sequence state, and findings tied to the current Trace messages |
Start with the question, not the visual style. When the question changes, switch views rather than forcing one projection to answer everything.
Best for: protocol order, packet direction, acknowledgement paths, MQTT properties, and the exact Payload Mqttable observed.
Grid shows the individual MQTT packets recorded in Trace. Read each row across: Timestamp, Client ID, Type, Route, Topic, QoS, Retain, and Payload or Reason. Open a row when the compact columns are not enough; Message Details keeps the selected packet's identity, Topic, Payload, properties, and sizes together.
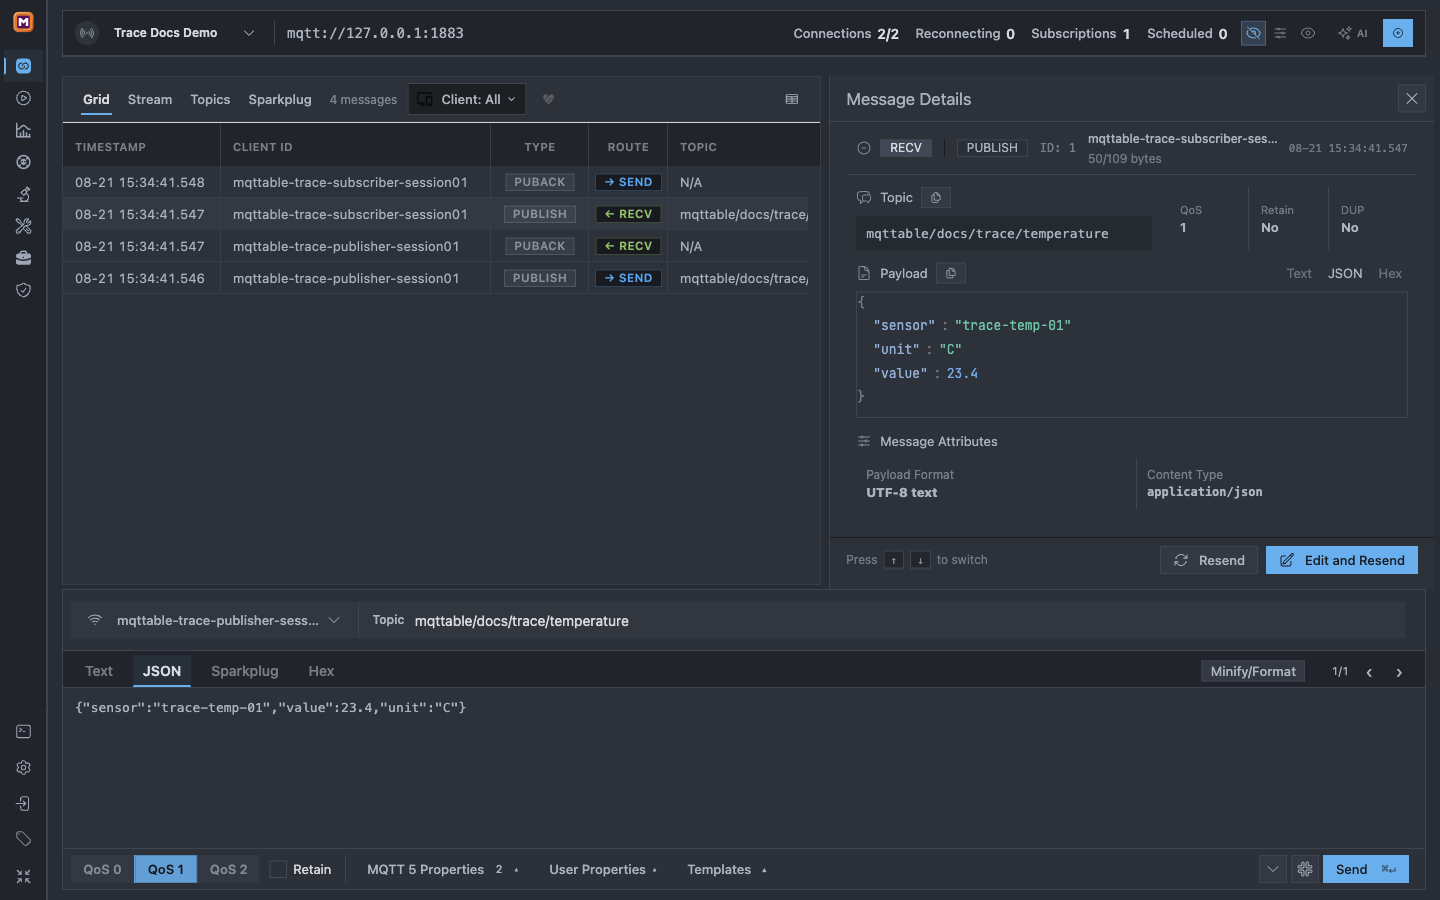
Grid preserves the packet-level story: two client sessions, four QoS 1 rows, and the selected received PUBLISH with its JSON and attributes.
Common misread: a Topic filter removes topicless packets such as PUBACK from the visible result. That does not prove the acknowledgement is missing. Reset the Topic filter before concluding that a control packet never appeared.
Switch away when: you need a trend rather than individual packets (Stream), or need to understand how many retained rows belong to each Topic (Topics).
Best for: telemetry drift, spikes, oscillation, and the field-level change between consecutive messages.
Stream deliberately narrows the view. Select one Client; Mqttable derives numeric series from that client's received PUBLISH messages. Series chips show the latest value, the chart aligns values in time, Topic tabs change the active comparison, and Payload Diff can compare the previous and current values.
The capture below comes from a Scheduled Message sent every 300 ms. Its JSON Payload Template renders fresh random temperature, humidity, and pressure values on every tick, producing exactly three lines with more than 1,000 samples per series across at least five minutes.
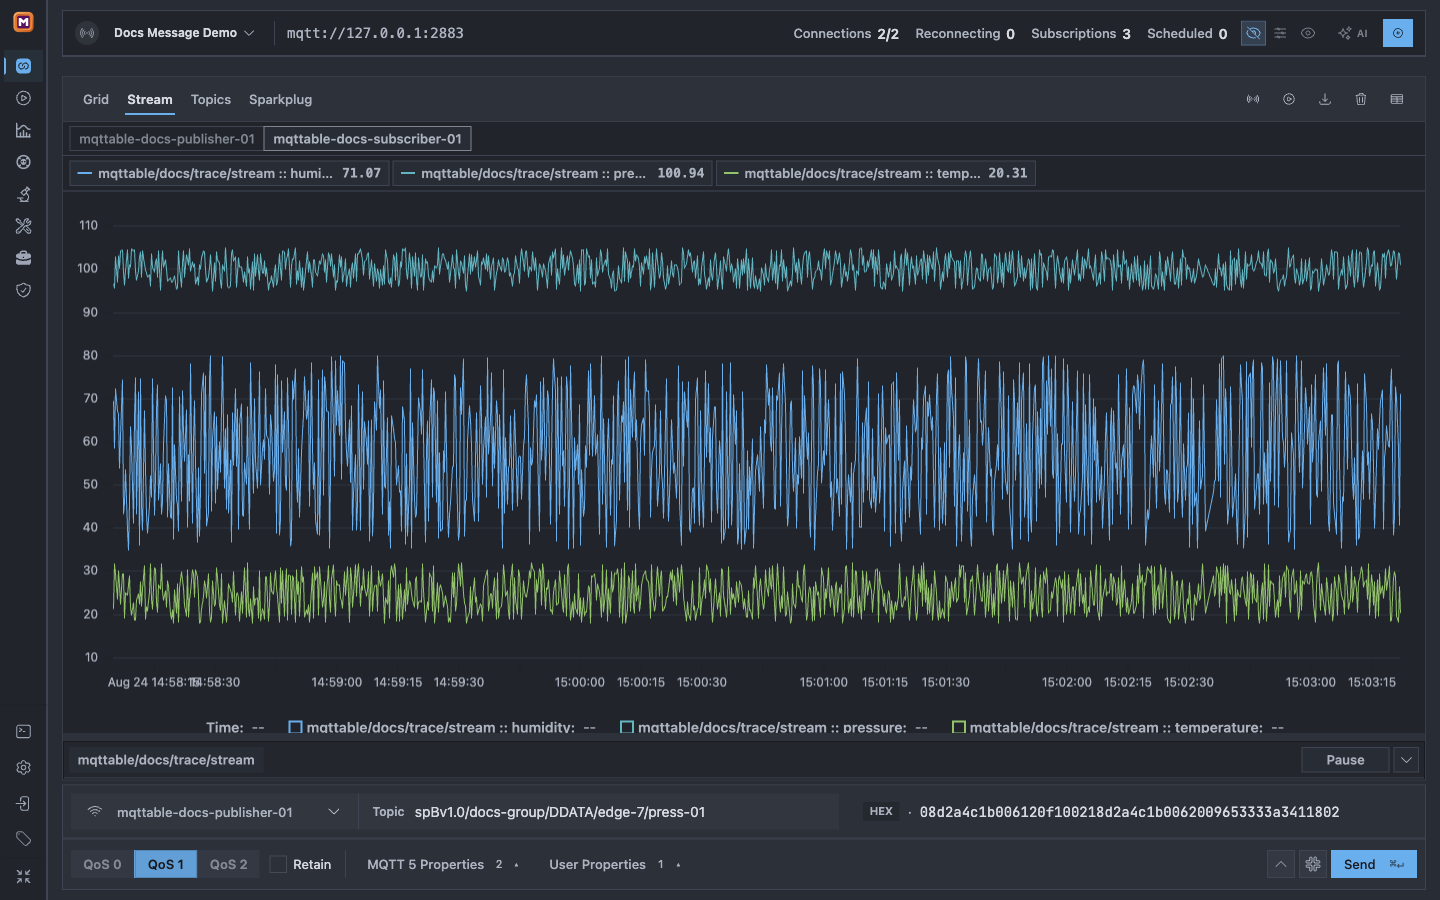
A 300 ms Scheduled Message renders three random numbers from a JSON Payload Template; Stream turns 1,000+ received samples per series across at least five minutes into exactly three lines.
Common misreads:
Switch away when: you need to verify PUBACK, flags, properties, or packet order (Grid); compare traffic across many Topics (Topics); or interpret Sparkplug lifecycle semantics (Sparkplug).
Best for: finding noisy namespaces, seeing which Topics dominate the retained traffic, and comparing SEND and RECV rows inside one Topic.
Topics groups the retained Trace rows by Topic. The count beside each group is the number of currently included rows, not a broker throughput metric. Expand a group to recover the original rows, including their Client ID, direction, QoS, Payload, and Timestamp. MQTT packets without a Topic are kept under No Topic rather than discarded.
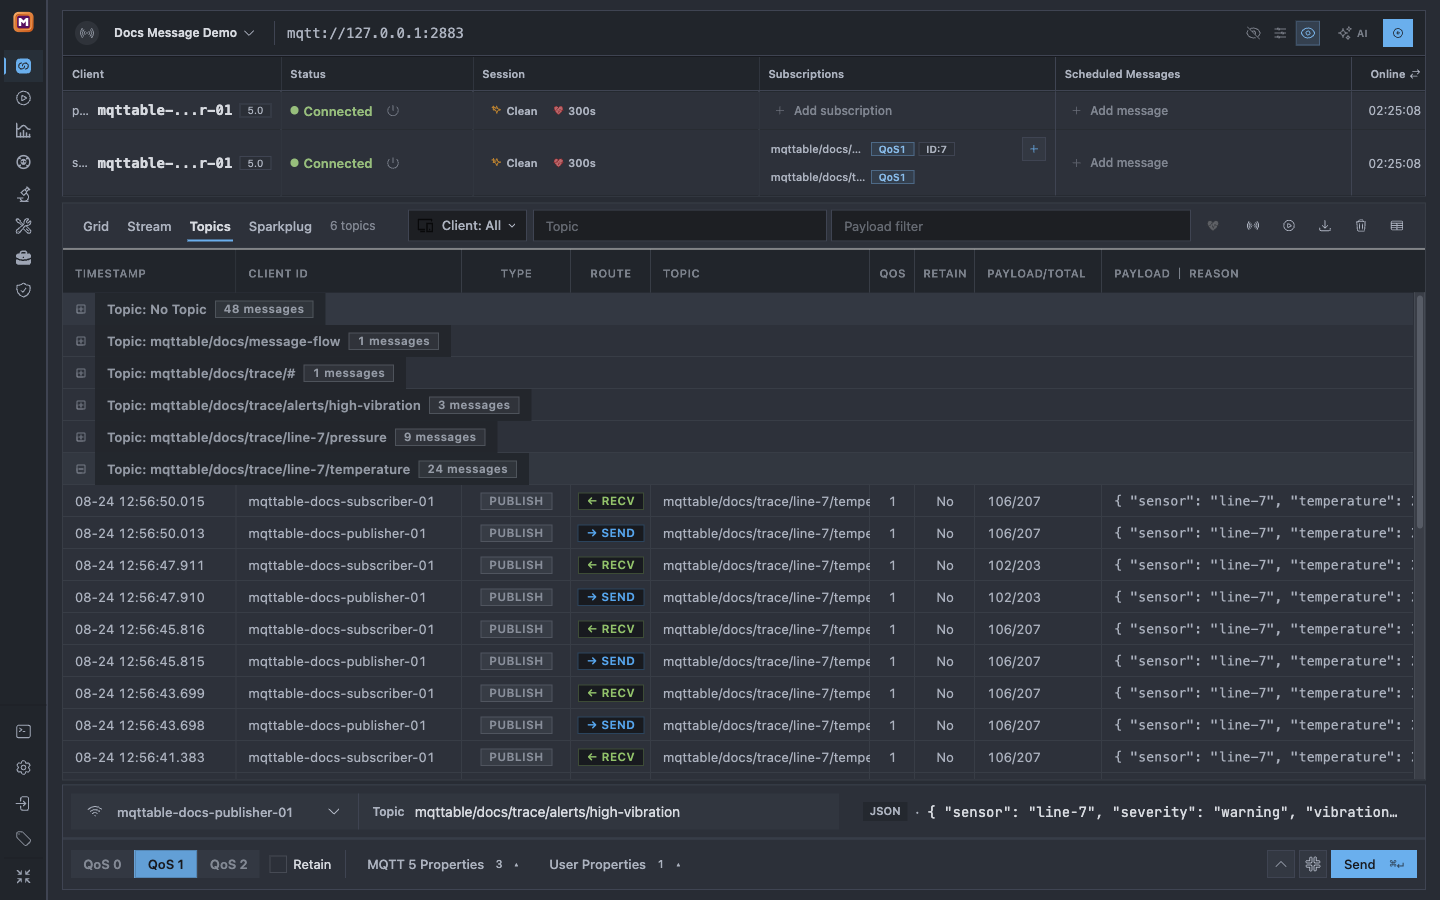
Topics exposes namespace shape without throwing away the packets: the temperature group expands into the publisher SEND and subscriber RECV rows.
Common misreads:
Switch away when: you need the exact cross-Topic order or Message Details (Grid), or a numeric value trend inside one Topic (Stream).
Best for: Sparkplug B node lifecycle, device inventory, metric aliases, sequence continuity, and protocol findings tied to the current Trace messages.
Sparkplug is a semantic reconstruction, not just another grouping. Mqttable recognizes Sparkplug Topics, decodes Protobuf Payloads, and builds node sessions from messages such as NBIRTH, NDATA, DBIRTH, and DDATA. Read the summary first, then the selected node's status, bdSeq, seq, devices, Recent Events, inventory, and Findings.
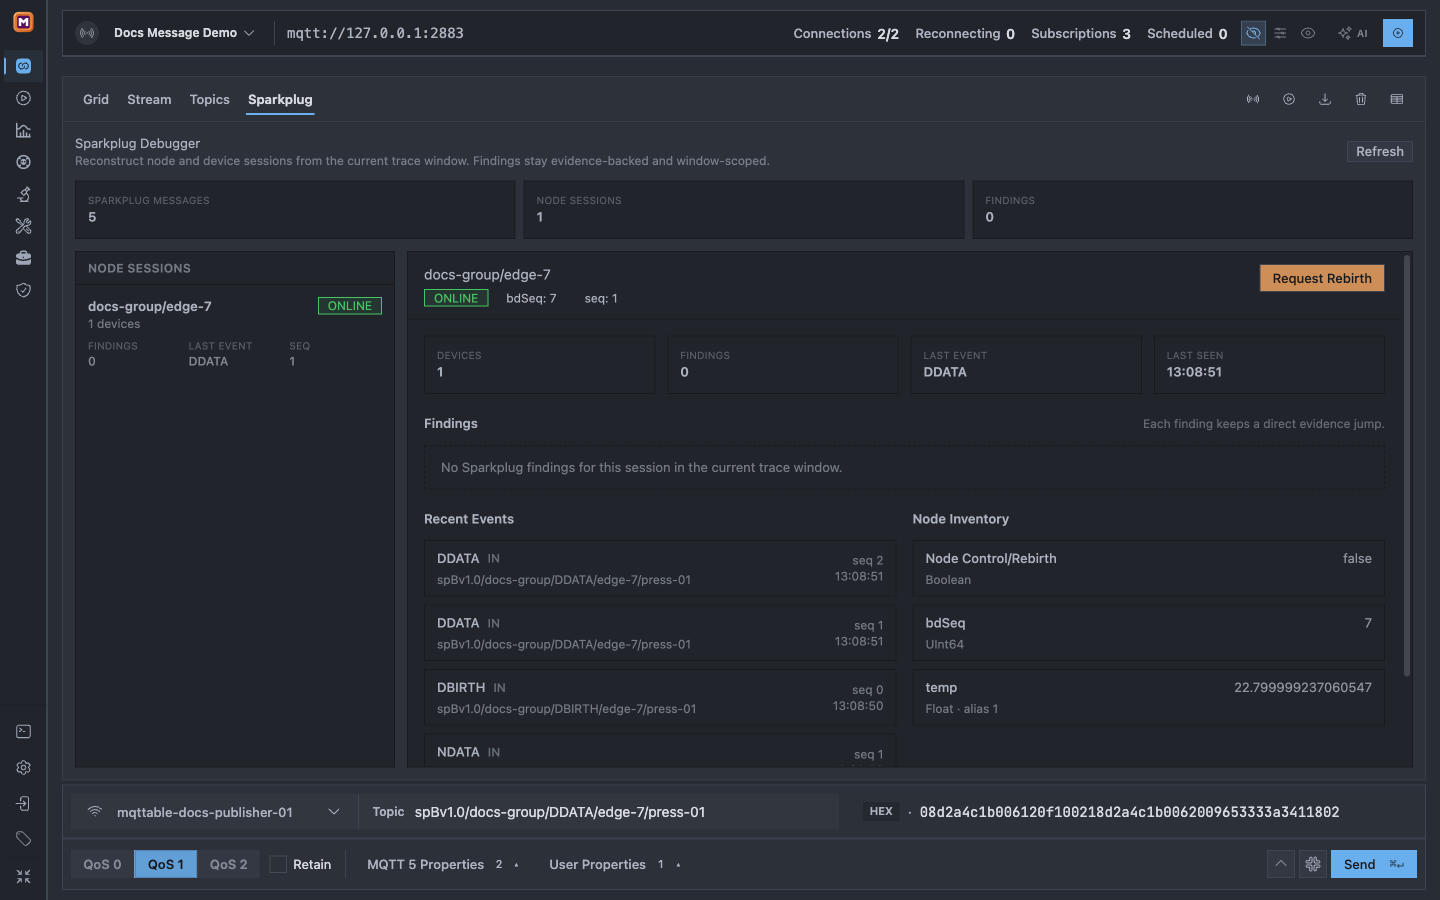
Five valid Sparkplug messages reconstruct an online node session, one device, sequence state, recent events, and node inventory.
Common misreads:
Switch away when: you need the original packet direction, Topic, binary Payload, or MQTT properties behind an event (Grid), or want to compare the full Sparkplug namespace by volume (Topics).
| Control | What it changes | Boundary to remember |
|---|---|---|
| Client | Limits Grid or Topics to selected clients; Stream selects exactly one client | A hidden client may still be active |
| Topic | Uses plain-text substring matching, or MQTT + / # wildcard matching | Matching is case-sensitive; topicless control packets disappear from the visible result |
| Payload filter | Finds a case-insensitive text substring in the rendered Payload | It is not a JSONPath, schema, or binary decoder |
| Heartbeat | Toggles PINGREQ and PINGRESP visibility | Hidden heartbeat rows still remain in Trace |
| Load older | Adds earlier Grid rows in bounded pages | Grid starts with the most recent 200 rows and cannot load beyond the Broker's configured retention cap |
| Sparkplug Refresh / session selection | Rebuilds or changes the semantic session shown | It uses the current Trace window; it does not fetch missing history from the Broker |
Filters change visibility, not retention. Before writing a conclusion, state the Broker tab, selected Client or session, active filters, and the Trace window you actually examined.
Each action has its own source and safety boundary. Do not assume a current filter, selected row, or visible chart automatically becomes the action's scope unless the UI explicitly shows it.
Trace shows the client-side SEND and RECV messages recorded by Mqttable, together with their Timestamp, packet fields, and Payload. Within the loaded rows, you can use it to understand ordering, value changes, Topic distribution, and reconstructed Sparkplug state.
Trace alone cannot show:
Be precise about what you saw: “Mqttable observed the subscriber receive this PUBLISH” describes the Trace result, while “the entire system processed the message” also requires downstream logs or application data. To inspect network packets outside the client view, continue with PCAP analysis.