Break the network before it breaks your MQTT system.
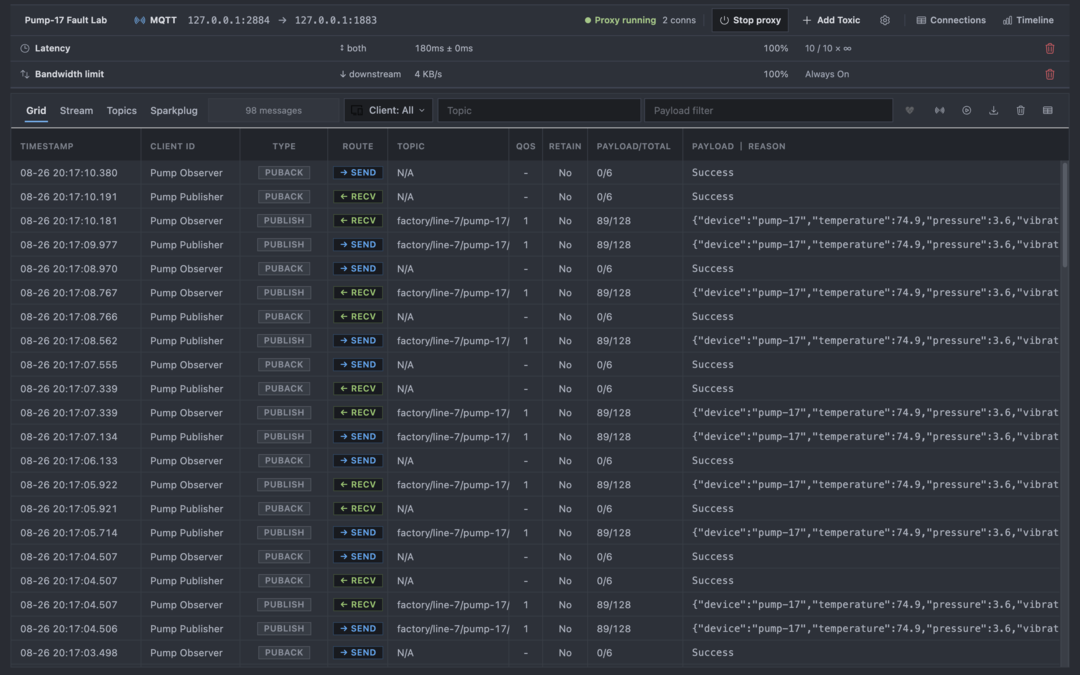
Place Mqttable between your MQTT clients and broker, then make the connection slow, congested, unreliable, or completely unavailable. See which messages arrive, how clients reconnect, and whether the system recovers before the same failure happens in production.
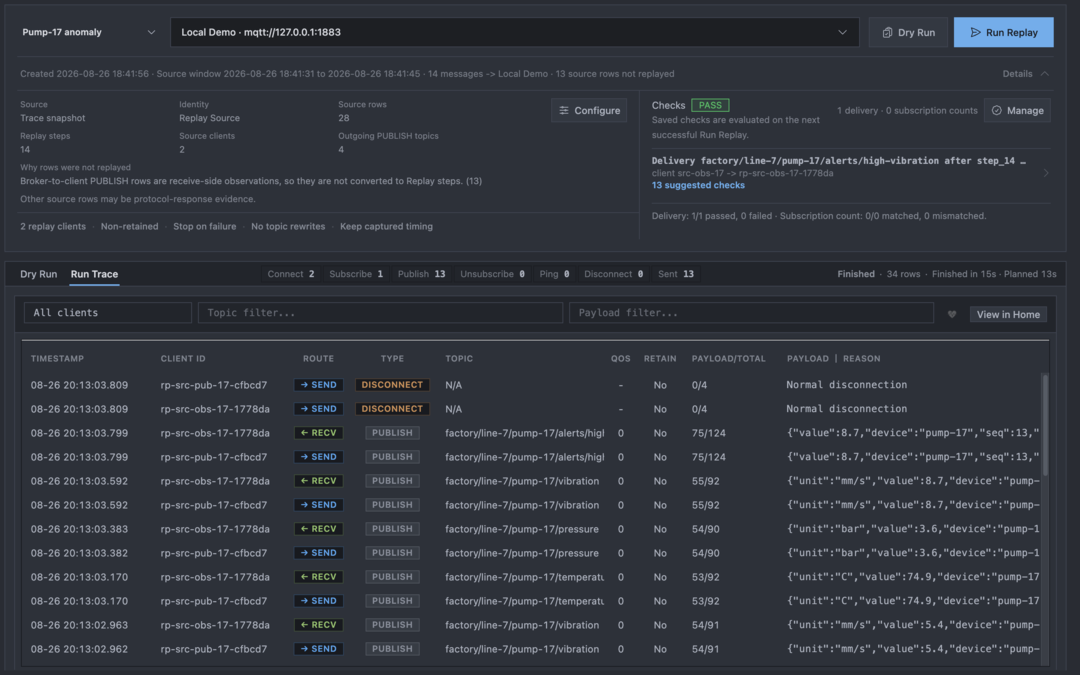
Build repeatable failure scenarios, inspect the results in Trace, and verify cleanup and recovery before production.
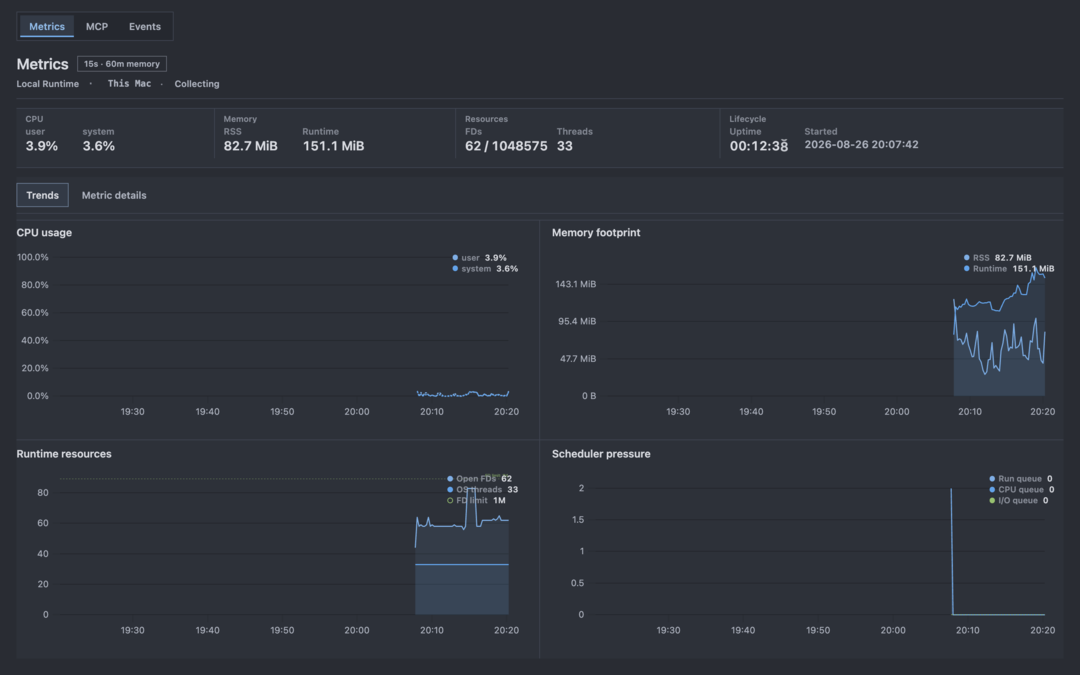
Stop asking what failed. With Mqttable MCP, your agent can inspect the runtime, operate MQTT, and verify the result.
Stop chatting.
Start operating MQTT.
Create connections, publish and subscribe, run bounded benchmarks, inject network faults, inspect traces, and analyze PCAPs through Mqttable MCP.
No hidden calls.
No unchecked changes.
MCP Monitor shows each tool’s calls, success rate, P95 latency, and last use, alongside recent issues, Plans, Apply, and Verification. Writes stay behind local authorization, and raw secrets stay out of MCP.
Progressive disclosure tools.
No context dump.
Nine stable tools reveal exact actions, schemas, and resources only when needed. The full capability catalog never floods the prompt, leaving more context for MQTT traces and diagnosis.
Compare where each app runs, which MQTT connections it supports, which testing and troubleshooting tasks it can handle, and how it performed on the same Apple M3 Mac.
AvailableIncluded in the appSeparate tool or partial support
Sources checkedNot found in the sources checked
Compare where each app runs, which MQTT connections it supports, which testing and troubleshooting tasks it can handle, and how it performed on the same Apple M3 Mac.
What you can compare
Mqttable1.2.0
MQTTX1.13.0
MQTT Explorer0.4.0-beta.6
MQTT.fx5.14.2
Installation and connections
How the app is builtThe main desktop technology used by each app.
Built with Tauri 2.11.5 and Phoenix 1.8.13.
Built with Electron 39.2.7.
Built with Electron 29.2.0.
Built with JavaFX 21.0.1 on JDK 21.0.1.
Where you can install itSupported desktop systems and computer types.
Available for macOS 15+ on Apple Silicon and Linux.
Available for Windows, macOS, and Linux.
A separate command-line app is also available.
Available for Windows, macOS, and Linux.
Available for Windows, macOS, and Linux.
MQTT versions and connection types
MQTT 3.1, 3.1.1, and 5.0
TCP, TLS, WebSocket (WS/WSS), and QUIC connections
MQTT 3.1, 3.1.1, and 5.0
TCP, TLS, and WebSocket (WS/WSS) connections
Uses MQTT 3.1.1; the version cannot be changed.
TCP, TLS, and WebSocket (WS/WSS) connections
MQTT 3.1.1 and 5.0
TCP, TLS, and WebSocket (WS/WSS) connections
Testing and troubleshooting
Follow messages without switching toolsSee live messages, search the history, and read their contents.
Included in the app
See live topics, search message history, and read text, JSON, or raw data without switching apps.
Included in the app
Browse live topics, inspect message contents, compare changes, and open JSON in a tree view.
Included in the app
Browse live topics, search and filter messages, view each topic’s history, compare changes, and chart numbers.
Included in the app
Browse topics, filter received messages, view history, and add decoders for different message formats.
Reproduce traffic without writing scriptsTurn saved MQTT traffic into a test you can run again.
Included in the app
Turn saved MQTT traffic, a CSV file, or a network capture into a test you can run again.
Separate tool or partial support
Scripts and a separate command-line app can repeat send-and-receive steps. The sources checked did not show replay of saved traffic from several clients.
Not found in the sources checked
Separate tool or partial support
Built-in scripts can repeat selected send-and-receive steps. The sources checked did not show replay of traffic previously captured from several clients.
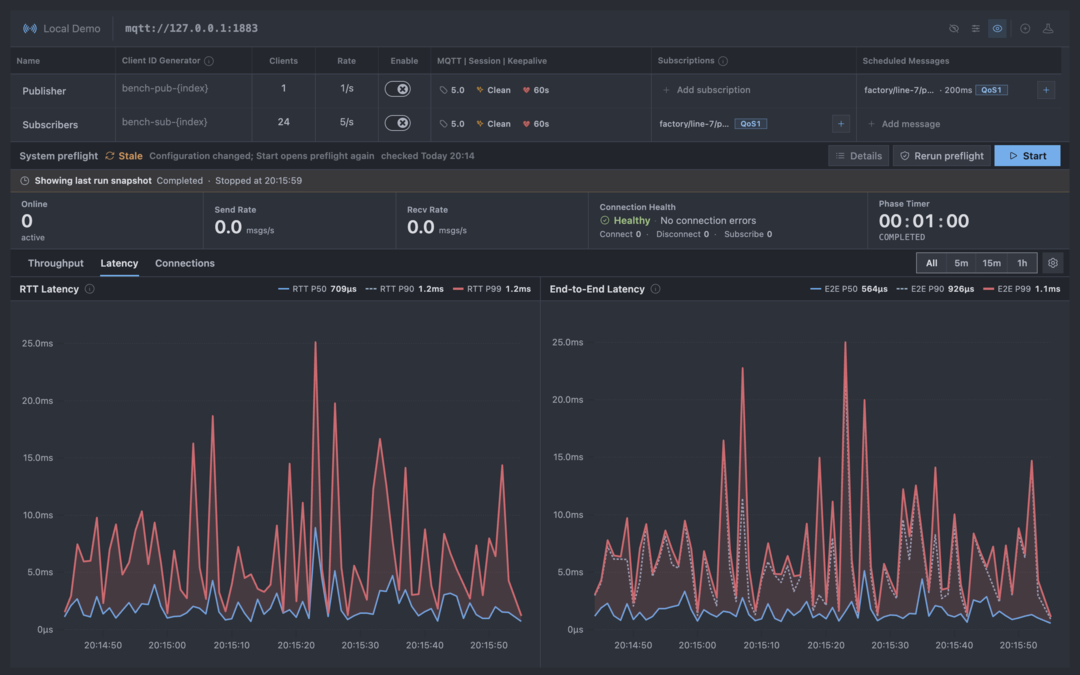
Create test traffic in the same appRun simulated clients and see how the MQTT broker responds.
Included in the app
Choose how many simulated clients to run and how often they send messages, then watch speed, delay, failures, connection health, and computer usage.
Separate tool or partial support
A separate command-line app can test connections, sending, and receiving; this is not included in the desktop app.
Not found in the sources checked
Separate tool or partial support
Scripts can create message traffic. The sources checked did not show a standard test that also tracks message delay and computer usage.
Test bad networks without changing your brokerTry delay, limited bandwidth, packet loss, timeouts, and disconnects.
Included in the app
Send test traffic through the app and add delay, bandwidth limits, packet loss, timeouts, or disconnects.
Not found in the sources checked
Not found in the sources checked
Not found in the sources checked
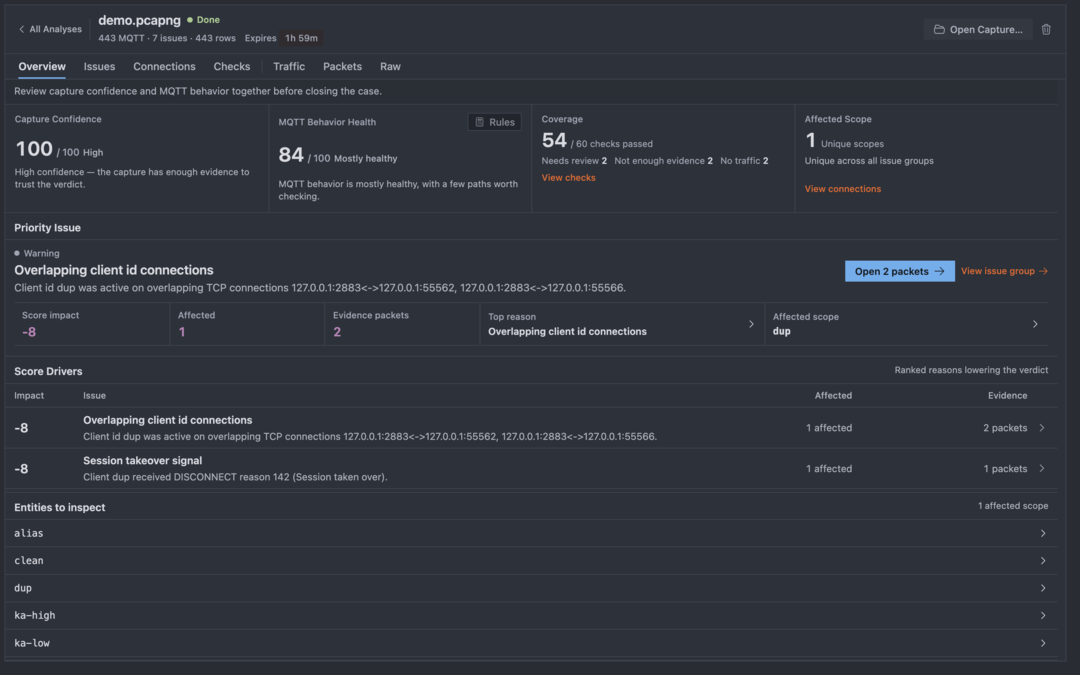
Start with findings, not raw packetsOpen a saved network traffic file (PCAP) and find likely MQTT problems.
Included in the app
The app highlights likely MQTT problems in a network capture and links each finding to the supporting packets.
Not found in the sources checked
Not found in the sources checked
Not found in the sources checked
Use automation without giving up controlRepeat MQTT tasks with scripts, command-line tools, or AI assistants.
Included in the app
Connect a compatible AI assistant while sensitive connection details stay hidden and changes remain permission-controlled.
Separate tool or partial support
Desktop scripts and a separate command-line app can automate messages. The sources checked did not show a built-in AI interface for the desktop app.
Not found in the sources checked
Separate tool or partial support
Built-in scripts can automate MQTT messages. The sources checked did not show a command-line or AI assistant interface.
MacBook Air with Apple M3 and 16 GB RAM. All four apps were measured together on macOS 26.6.2 on Sep 2, 2026. Each result uses one warm-up and five measured launches with product order rotated between rounds; Footprint and RSS use their own five-run medians.
MacBook Air with Apple M3 and 16 GB RAM. All four apps were measured together on macOS 26.6.2 on Sep 2, 2026. Each result uses one warm-up and five measured launches with product order rotated between rounds; Footprint and RSS use their own five-run medians.
Metric
Mqttable1.2.0
MQTTX1.13.0
MQTT Explorer0.4.0-beta.6
MQTT.fx5.14.2
Warm launch to usable workspace
1.35 s
2.46 s
2.05 s
3.80 s
Memory footprint 30 seconds after ready
339.3 MiB
321.4 MiB
191.3 MiB
479.7 MiB
Resident set 30 seconds after ready
Tauri / Rust host
160.4 MiB
BEAM runtime
98.4 MiB
WebKit WebContent
73.9 MiB
WebKit GPU
40.4 MiB
WebKit Networking
22.3 MiB
Total
395.4 MiB
Electron main
195.2 MiB
Electron Renderer
233.2 MiB
Electron GPU
99.0 MiB
Electron Networking
51.9 MiB
Total
579.3 MiB
Electron main
148.7 MiB
Electron Renderer
161.4 MiB
Electron GPU
76.1 MiB
Electron Networking
42.6 MiB
Crash handler
9.9 MiB
Total
438.7 MiB
JVM / JavaFX
639.8 MiB
Total
639.8 MiB
Installed app size
68 MiB
317 MiB
269 MiB
434 MiB
Installation and connections
How the app is built
The main desktop technology used by each app.
Mqttable
Built with Tauri 2.11.5 and Phoenix 1.8.13.
MQTTX
Built with Electron 39.2.7.
Where you can install it
Supported desktop systems and computer types.
Mqttable
Available for macOS 15+ on Apple Silicon and Linux.
MQTTX
Available for Windows, macOS, and Linux.
A separate command-line app is also available.
MQTT versions and connection types
Mqttable
MQTT 3.1, 3.1.1, and 5.0
TCP, TLS, WebSocket (WS/WSS), and QUIC connections
MQTTX
MQTT 3.1, 3.1.1, and 5.0
TCP, TLS, and WebSocket (WS/WSS) connections
Testing and troubleshooting
Follow messages without switching tools
See live messages, search the history, and read their contents.
Mqttable
Included in the app
See live topics, search message history, and read text, JSON, or raw data without switching apps.
MQTTX
Included in the app
Browse live topics, inspect message contents, compare changes, and open JSON in a tree view.
Reproduce traffic without writing scripts
Turn saved MQTT traffic into a test you can run again.
Mqttable
Included in the app
Turn saved MQTT traffic, a CSV file, or a network capture into a test you can run again.
MQTTX
Separate tool or partial support
Scripts and a separate command-line app can repeat send-and-receive steps. The sources checked did not show replay of saved traffic from several clients.
Create test traffic in the same app
Run simulated clients and see how the MQTT broker responds.
Mqttable
Included in the app
Choose how many simulated clients to run and how often they send messages, then watch speed, delay, failures, connection health, and computer usage.
MQTTX
Separate tool or partial support
A separate command-line app can test connections, sending, and receiving; this is not included in the desktop app.
Test bad networks without changing your broker
Try delay, limited bandwidth, packet loss, timeouts, and disconnects.
Mqttable
Included in the app
Send test traffic through the app and add delay, bandwidth limits, packet loss, timeouts, or disconnects.
MQTTX
Not found in the sources checked
Start with findings, not raw packets
Open a saved network traffic file (PCAP) and find likely MQTT problems.
Mqttable
Included in the app
The app highlights likely MQTT problems in a network capture and links each finding to the supporting packets.
MQTTX
Not found in the sources checked
Use automation without giving up control
Repeat MQTT tasks with scripts, command-line tools, or AI assistants.
Mqttable
Included in the app
Connect a compatible AI assistant while sensitive connection details stay hidden and changes remain permission-controlled.
MQTTX
Separate tool or partial support
Desktop scripts and a separate command-line app can automate messages. The sources checked did not show a built-in AI interface for the desktop app.
MacBook Air with Apple M3 and 16 GB RAM. All four apps were measured together on macOS 26.6.2 on Sep 2, 2026. Each result uses one warm-up and five measured launches with product order rotated between rounds; Footprint and RSS use their own five-run medians.
MqttableMQTTX
Warm launch to usable workspace
1.35 s2.46 s
Memory footprint 30 seconds after ready
339.3 MiB321.4 MiB
Resident set 30 seconds after ready
Mqttable
Tauri / Rust host
160.4 MiB
BEAM runtime
98.4 MiB
WebKit WebContent
73.9 MiB
WebKit GPU
40.4 MiB
WebKit Networking
22.3 MiB
Total
395.4 MiB
MQTTX
Electron main
195.2 MiB
Electron Renderer
233.2 MiB
Electron GPU
99.0 MiB
Electron Networking
51.9 MiB
Total
579.3 MiB
Installed app size
68 MiB317 MiB
Sources and benchmark method
Scope and method
Capability rows use current first-party sources and the exact versions shown. “Not documented” is an evidence boundary, not a claim that a capability cannot exist.
Mqttable: 1.2.0. Competitors used official Apple Silicon installers.
Ready means: Mqttable returned 200 from /__desktop/ready and exposed Connections plus Connect Now; MQTTX showed Connections and an enabled New Connection action; MQTT Explorer showed its Connections form; MQTT.fx passed Continue Without License and showed Namespace Explorer, Connect, and Publish. Thirty seconds later, the runner captured RSS and then a multi-PID macOS footprint. No broker connection or workload was used.
Every product used isolated app-data and reused the clean state created by its warm-up. All four apps were measured in the same run, with product order rotated between rounds. MQTT Explorer was ad-hoc re-signed after its bundled signature failed validation. Footprint de-duplicates multiply mapped objects within the attributed PID set; RSS may count shared pages more than once. Mqttable WebContent and Networking were tied to its bundle data paths, while its paired GPU process was identified by the launch/quit lifecycle.
Free local workbench
The complete MQTT workbench, free to start.
Connect, inspect, replay, benchmark, proxy, analyze PCAPs, monitor runtimes, and use local MCP. Free covers everyday MQTT engineering; upgrade only when an investigation needs more scale, longer runs, or full evidence.
Mqttable Free
The complete local workbench for everyday MQTT engineering, with clear investigation limits.
$0/ forever
Connections, Trace, Replay, Proxy, Bench, PCAP, Monitor, Tools, and exports
3 Broker, Proxy, Replay, and PCAP workspaces
15-step Replay, 10-minute Bench, and the top 5 PCAP check details
Local MCP discovery, redacted reads, and bounded operations