Analyze Mqttable’s built-in demo capture, trace an overlapping Client ID to CONNECT and DISCONNECT evidence, and write a bounded session-takeover conclusion.
Author:
Mqttable
Updated:
On this page12 sections
Loading...
When an MQTT client reports only “disconnected,” a packet capture can show whether the wire evidence supports a more specific explanation. This guide investigates why the synthetic client dup was disconnected and follows the result from Overview to the exact CONNECT and DISCONNECT packets.
The workflow uses Mqttable's built-in demo.pcapng. It contains synthetic clients and loopback endpoints only, so it needs no Broker, connection, credentials, or user-provided capture. Without Mqttable installed, the screenshots still show every state and result; installing and opening Mqttable is required to run the analysis.
What PCAP is and when to use it
A PCAP (packet capture) records network packets observed at a particular capture point and time window. Mqttable decodes supported MQTT traffic, checks whether the capture can support a conclusion, and links diagnostic results back to exact packets.
Use PCAP when a client-side Trace does not provide enough evidence about what happened on the wire. It can verify MQTT control packets, direction and ordering, overlapping connection windows, and protocol-level disconnect reasons. A capture proves only what was visible at its collection point and time window; it cannot prove application processing, every Broker-internal event, or a unique root cause by itself.
Tutorial goal and completion criteria
This tutorial uses the built-in demo.pcapng to investigate a session takeover involving the synthetic client dup. It needs no Broker, connection, credentials, or user-provided capture.
By the end of the tutorial, you should be able to:
wait until the analysis is Done and open Overview;
confirm that dup sent CONNECT packets on two TCP connections with overlapping time windows;
confirm a DISCONNECT carrying 0x8E / 142, or Session taken over;
separate direct observations, a bounded conclusion, and what still needs verification;
delete the Demo and confirm that Previous Analyses returns to No previous analyses.
Start the built-in Demo
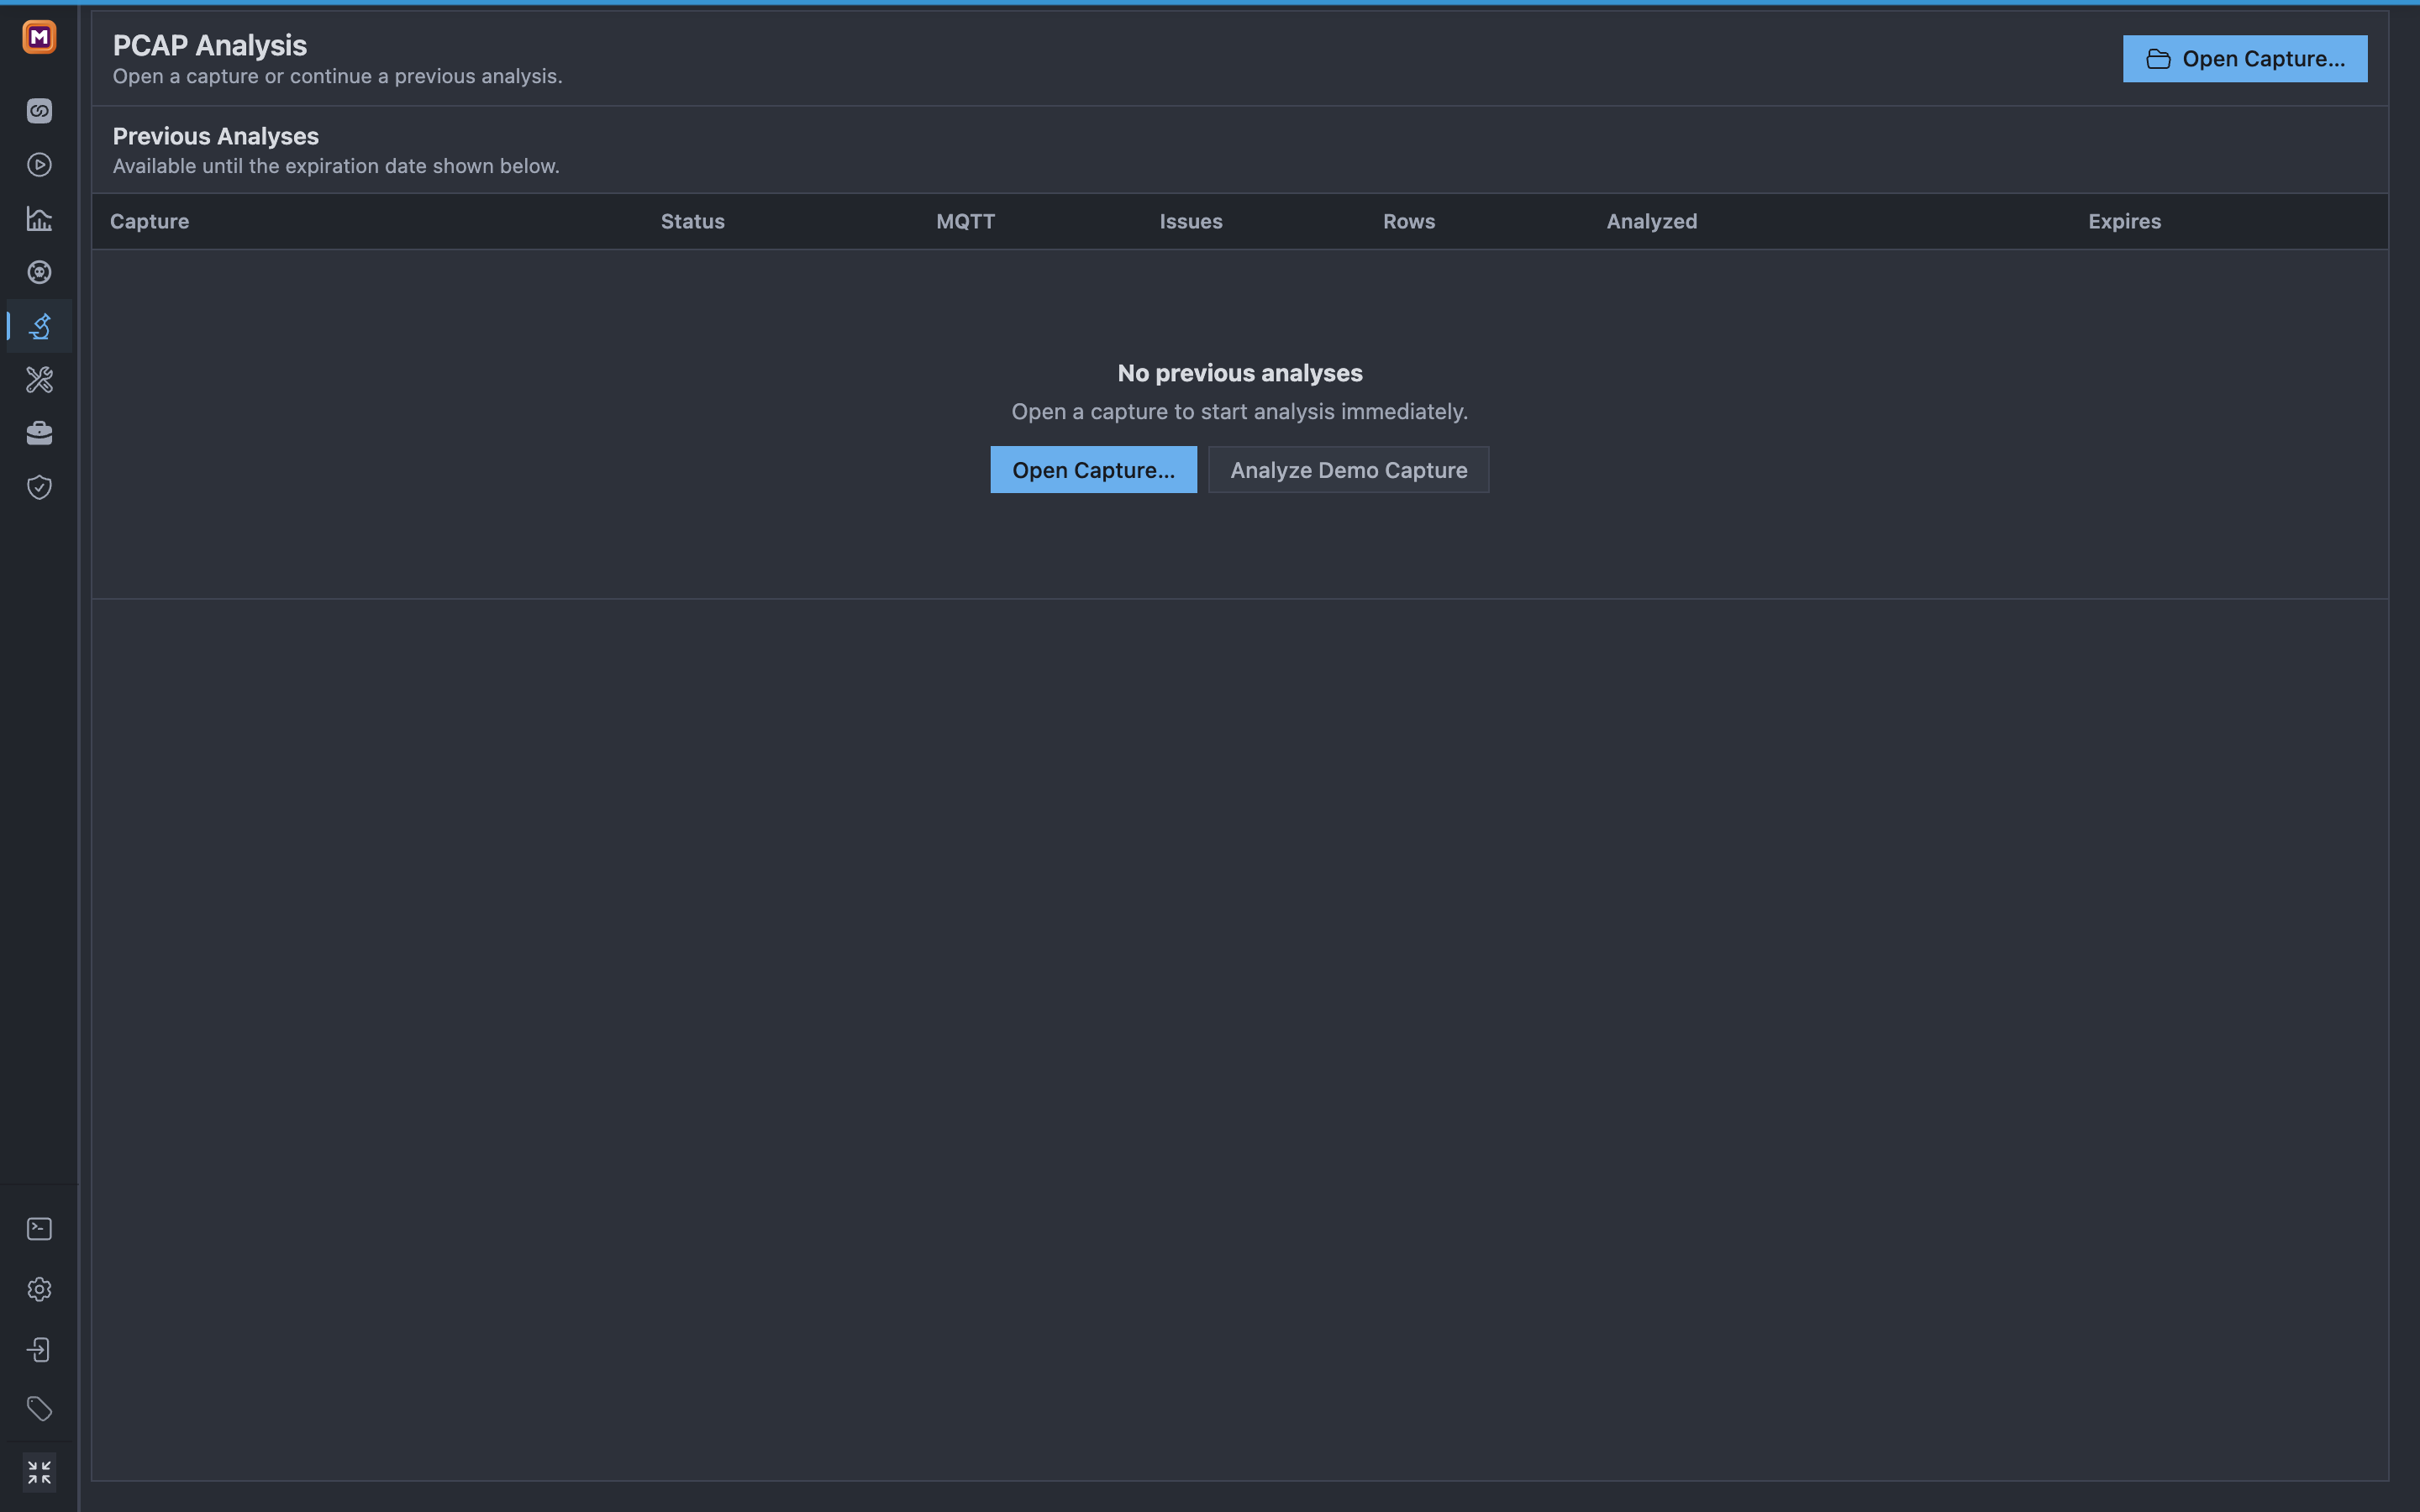
In the Mqttable sidebar, select PCAP.
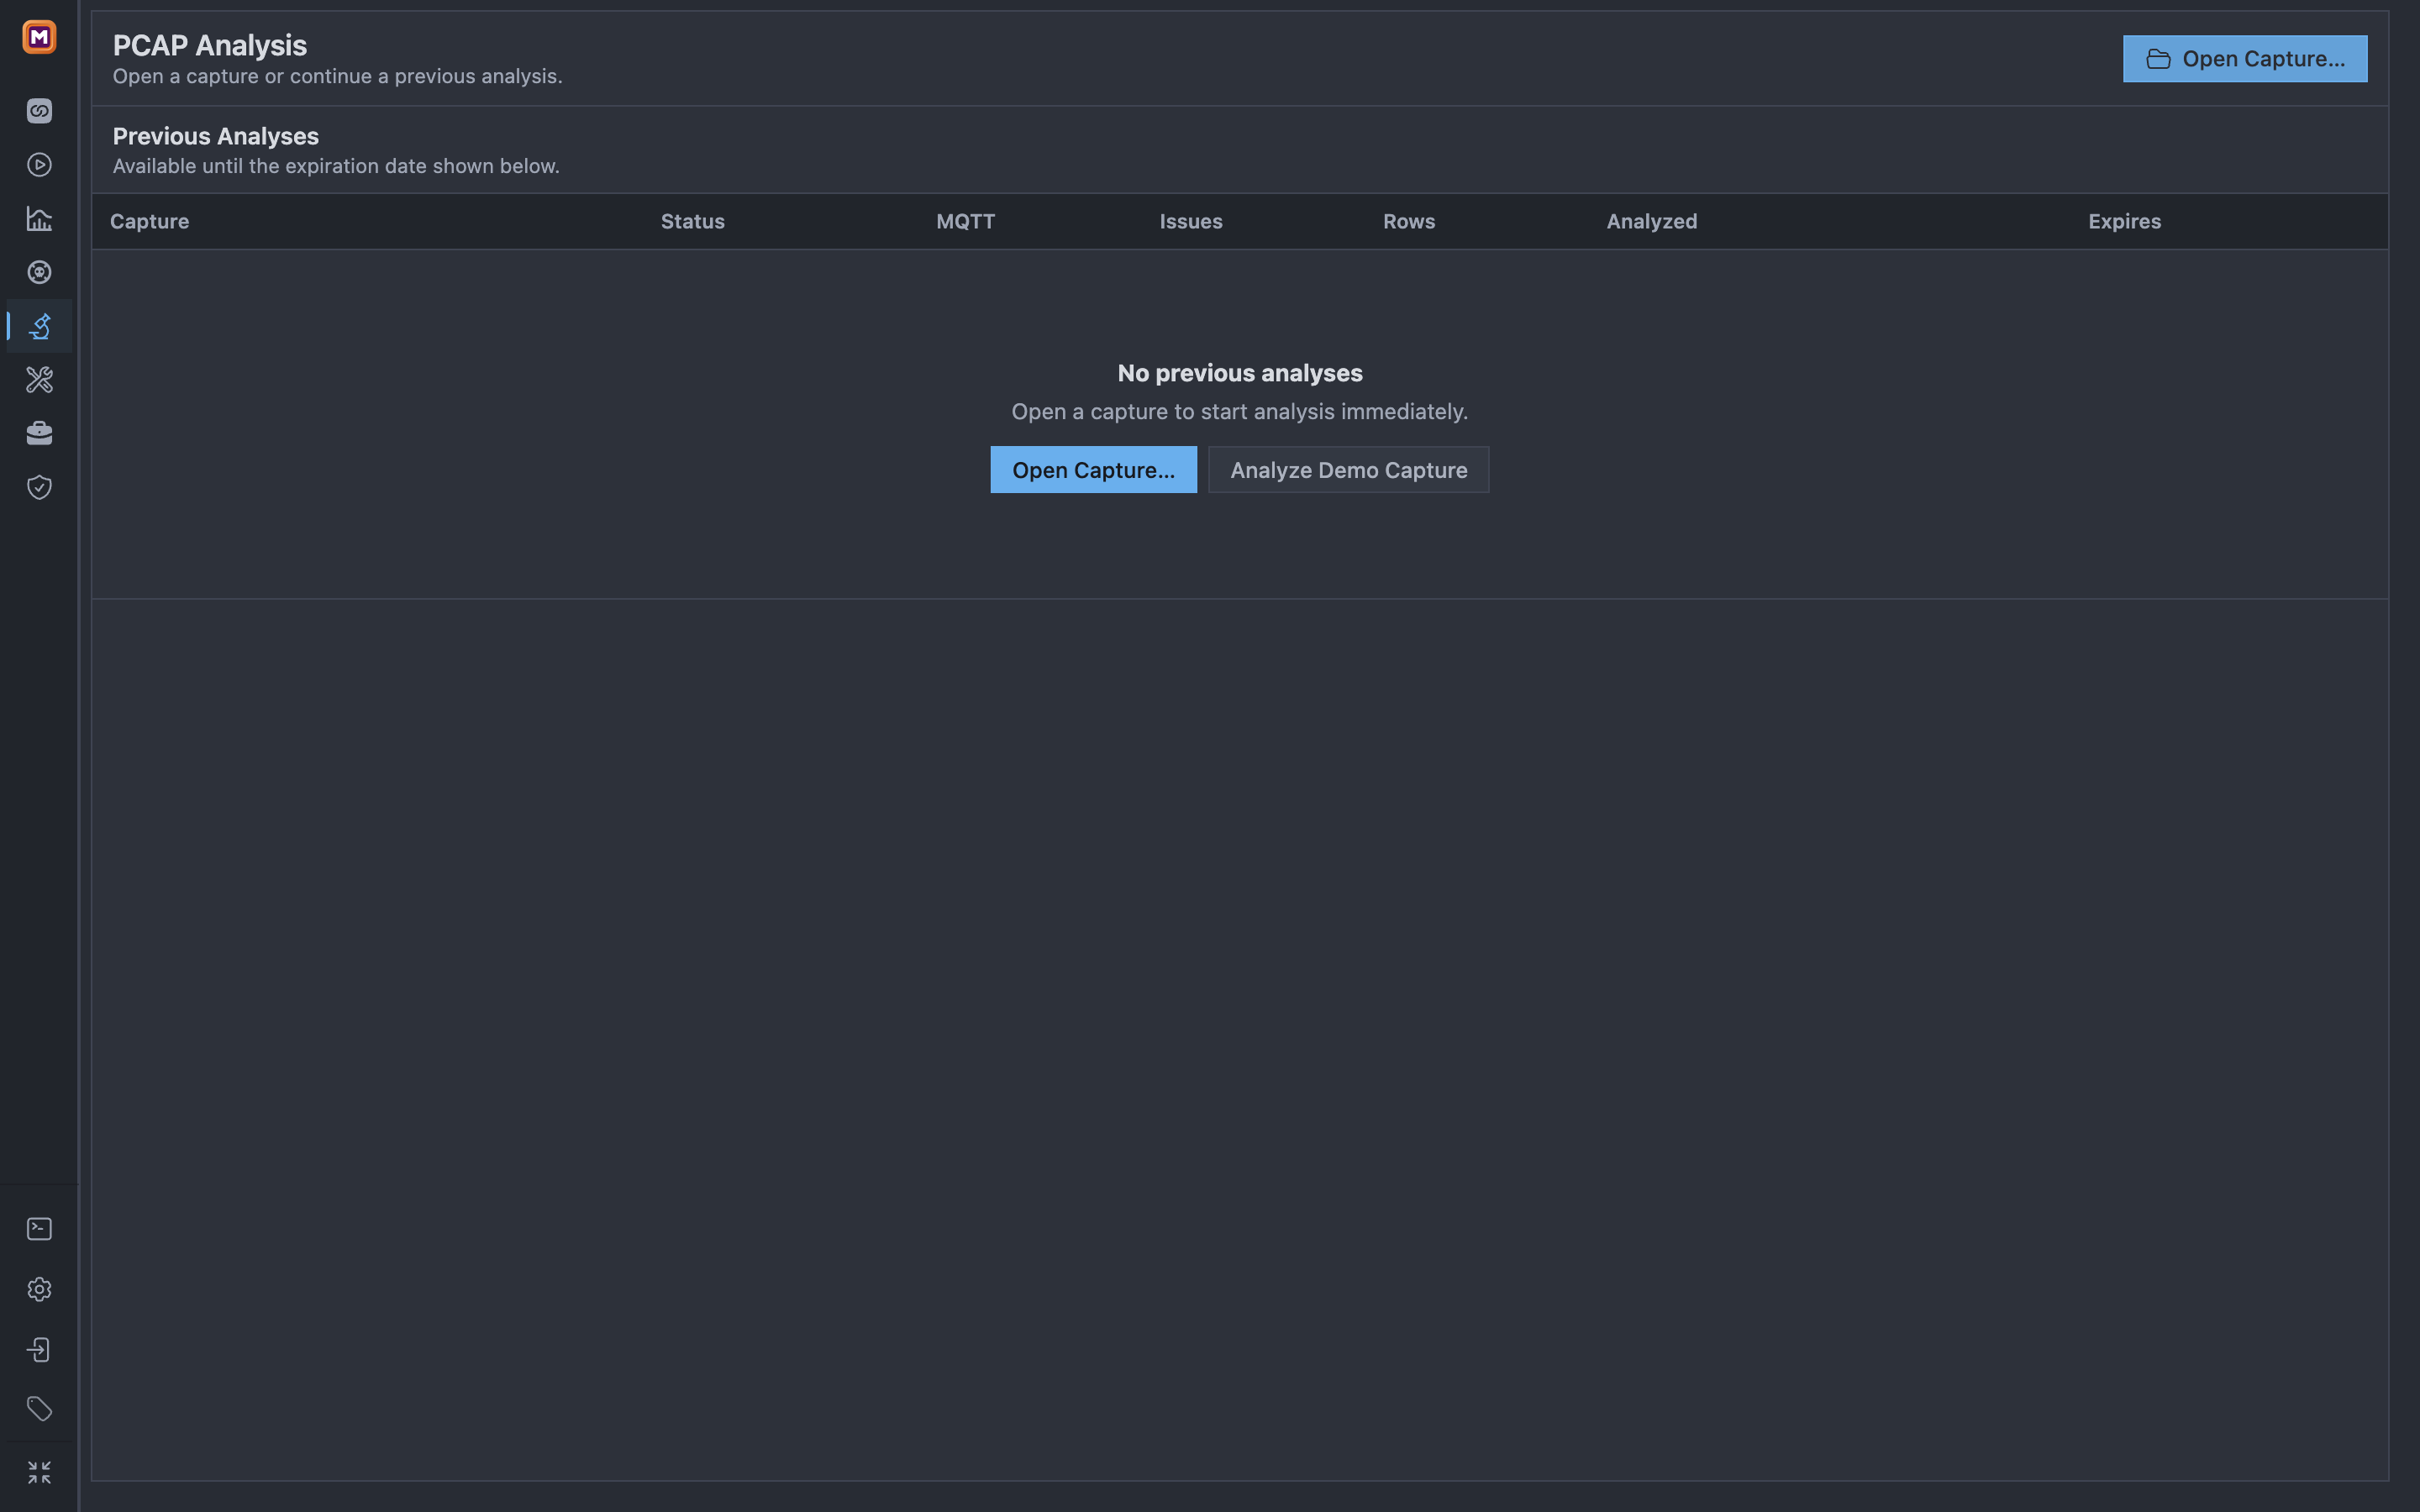
Confirm that Previous Analyses says No previous analyses.
A first-use PCAP workspace starts with an empty previous-analysis list and a safe built-in Demo action.
1Open PCAP from the diagnostic workspaces in the sidebar.
2Continue only when the list says No previous analyses.
3Analyze Demo Capture starts the bundled synthetic capture.
If the Demo action is missing, stop. This Runtime already has a previous analysis. Do not delete a capture you do not recognize just to follow this guide; the Demo action is intentionally shown only in the empty state.
Wait for a completed analysis
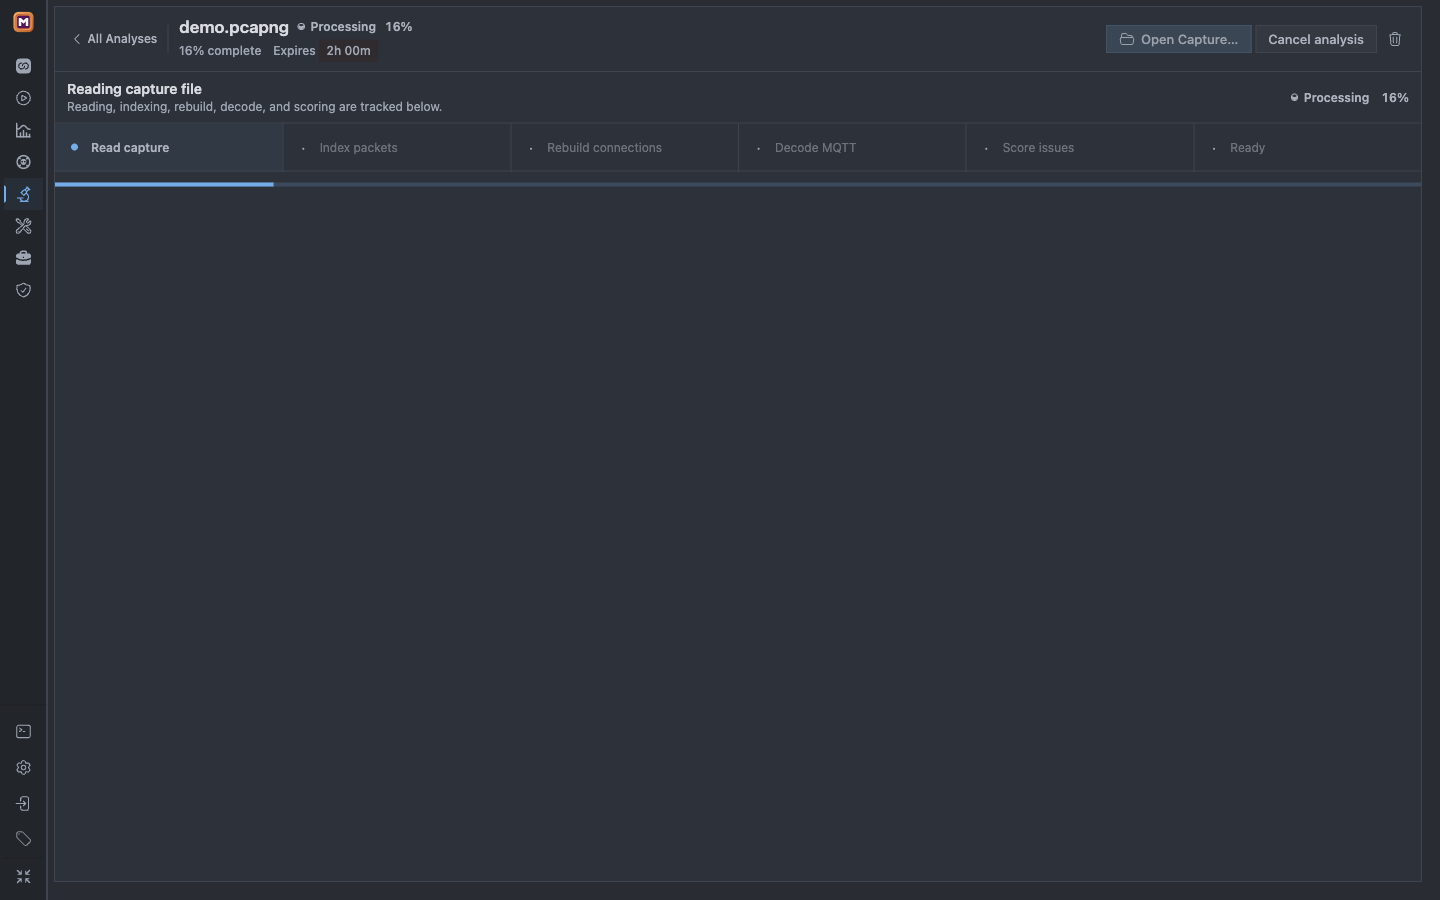
Mqttable immediately creates an analysis for demo.pcapng. While the status is Processing, the percentage and six pipeline stages show that work is still in progress. Cancel analysis stops the job; it is not a success action.
Processing is observable but not conclusive: wait until every stage finishes and the status changes to Done.
1Processing and the percentage mean demo.pcapng is still being analyzed.
2The pipeline reads, indexes, rebuilds, decodes, scores, and becomes ready.
3Cancel analysis stops the job and is not part of this successful path.
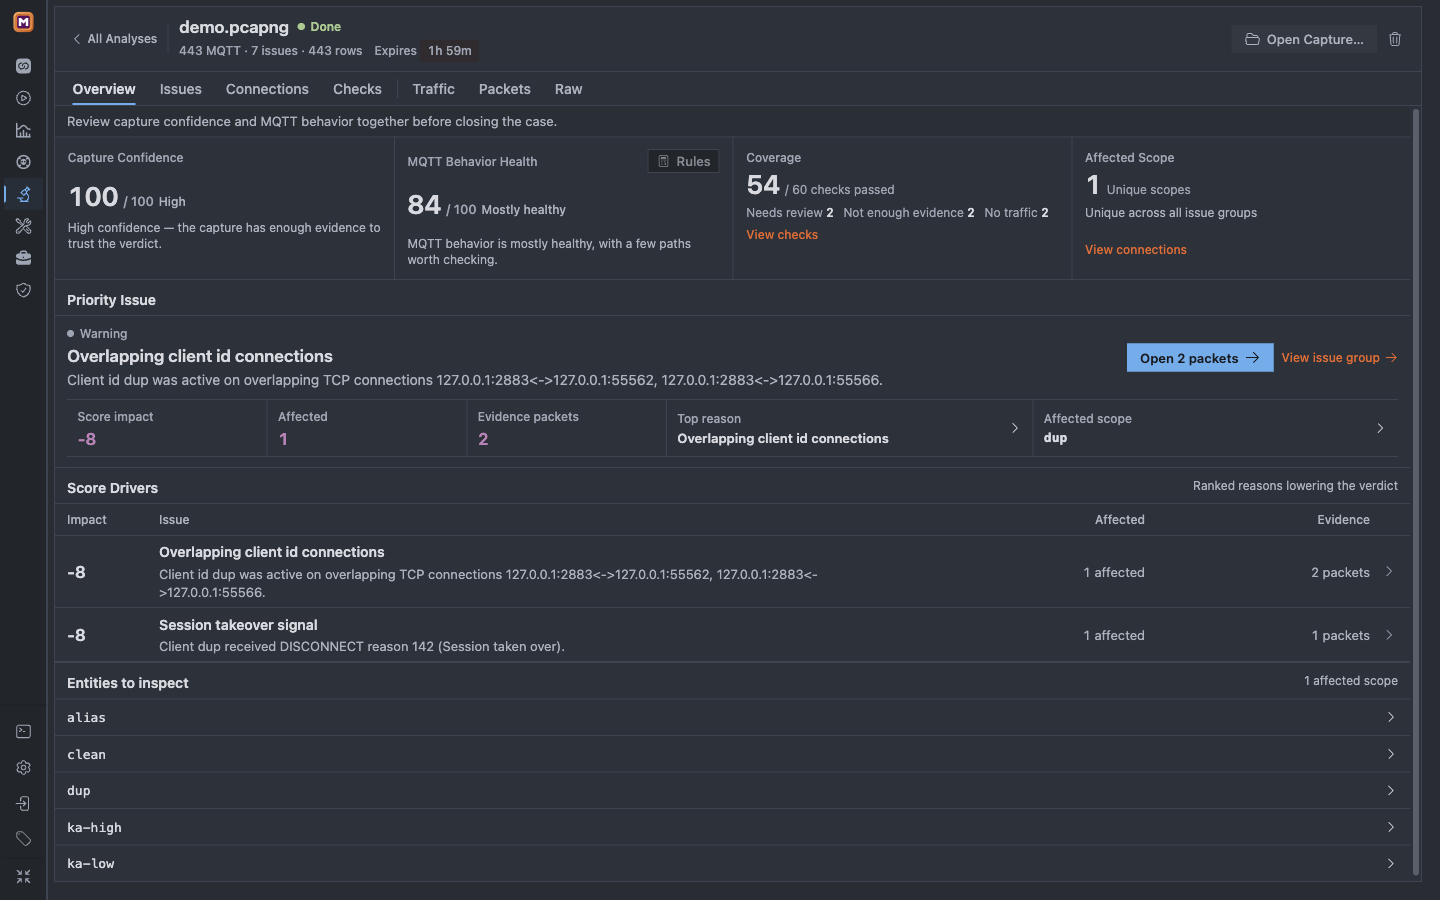
Continue only after the status changes to Done and Overview appears. In Mqttable v1.0.1, the bundled Demo decodes 443 MQTT packets, reports 7 issues, and passes 54 of 60 checks.
Overview separates capture trust from MQTT behavior and points to the highest-priority evidence path.
1Done with 443 MQTT packets and 7 issues is the completion checkpoint.
2Read Capture Confidence and MQTT Behavior Health as separate results.
3Coverage shows 54 of 60 checks passed before Priority Issue ranks the next path.
Read the results in this order:
Capture Confidence 100 / High means the capture is complete enough to support the displayed packet-level conclusion. It is not a Broker health score.
MQTT Behavior Health 84 / Mostly healthy means most decoded behavior looks healthy, but evidence-backed exceptions remain.
Coverage 54 / 60 means 54 checks passed, 2 need review, 2 lack enough evidence, and 2 have no relevant traffic. “Not enough evidence” and “No traffic” are not passes.
Priority Issue is the recommended investigation entry, not an automatic final root cause.
Open the priority issue
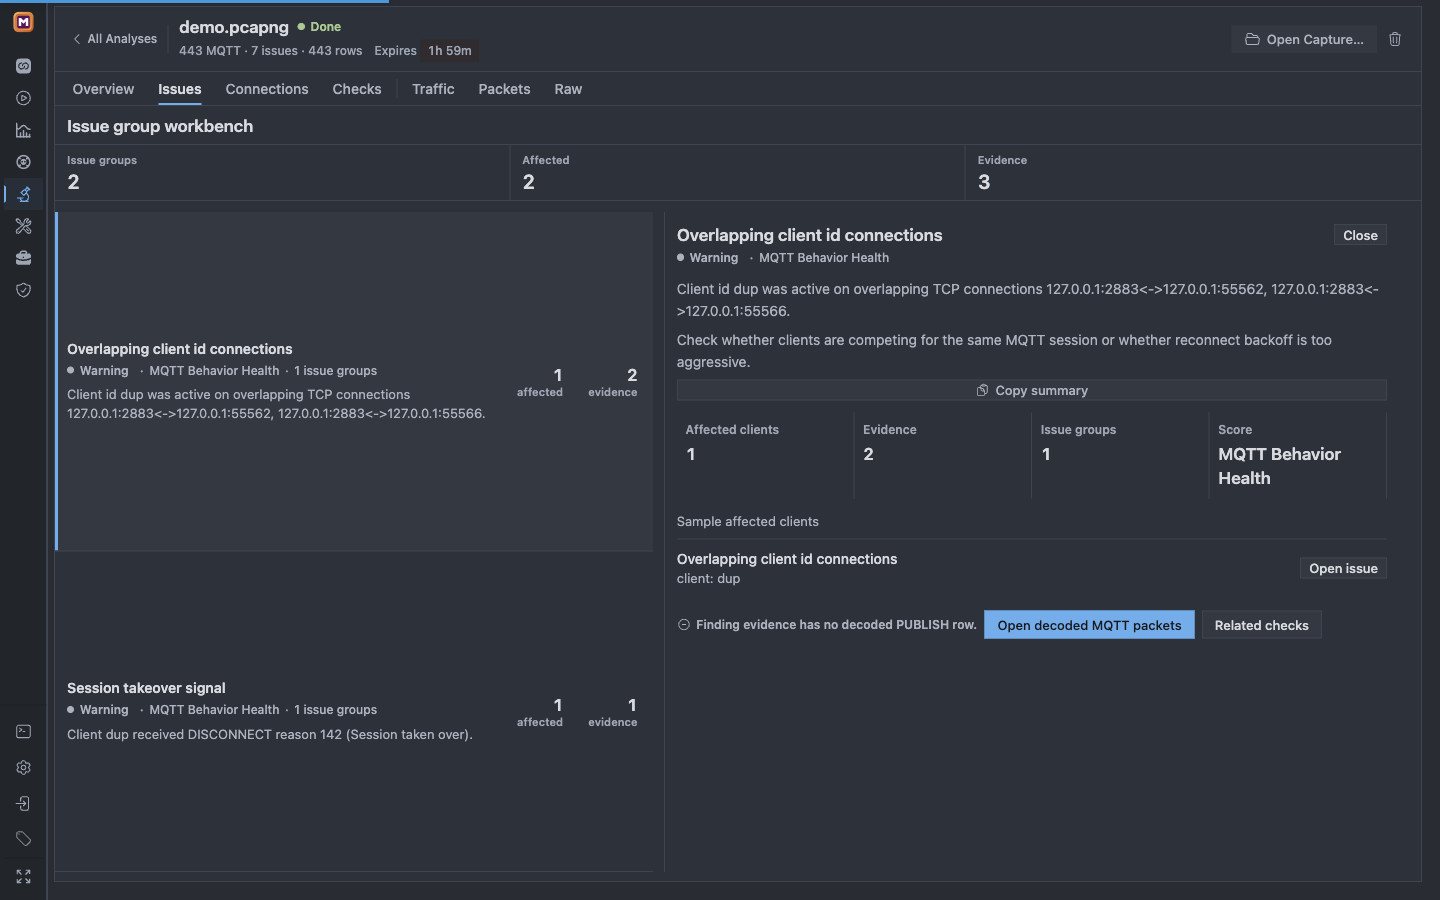
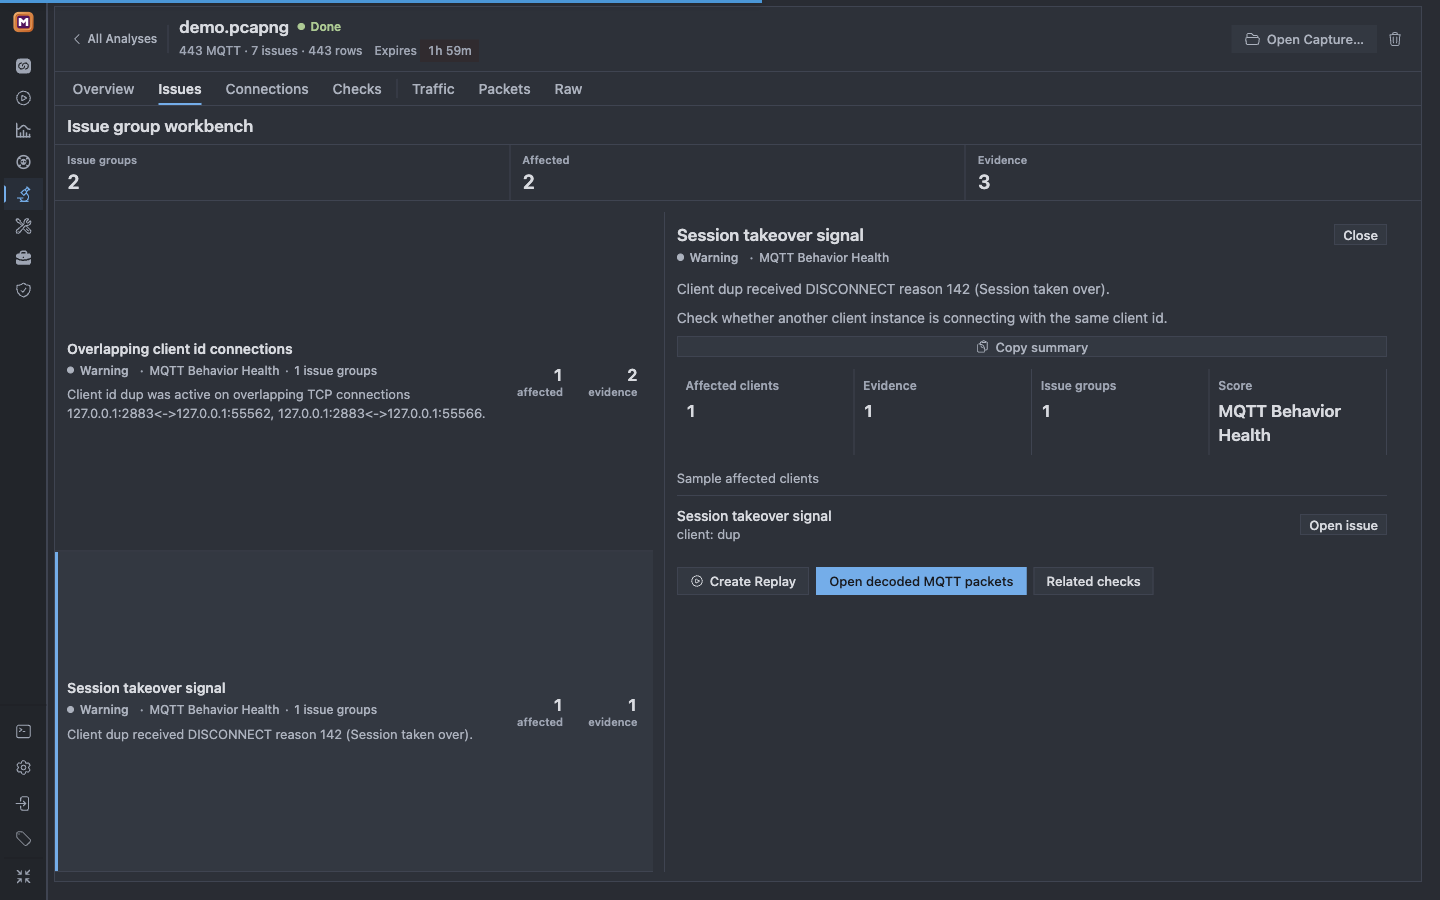
In Priority Issue, select View issue group. Continue only when the detail is Overlapping client id connections.
The issue group keeps the affected client, endpoints, evidence count, and next action together.
1Client dup was active on two overlapping TCP connections.
2The endpoints use loopback ports 55562 and 55566 with two evidence packets.
3Open decoded MQTT packets continues from diagnosis to wire evidence.
Record the exact facts:
Client ID: dup
First connection: 127.0.0.1:2883<->127.0.0.1:55562
Second connection: 127.0.0.1:2883<->127.0.0.1:55566
Evidence packets: 2
The issue group deduplicates repeated hits. It does not identify which processes created the connections.
Inspect the CONNECT evidence
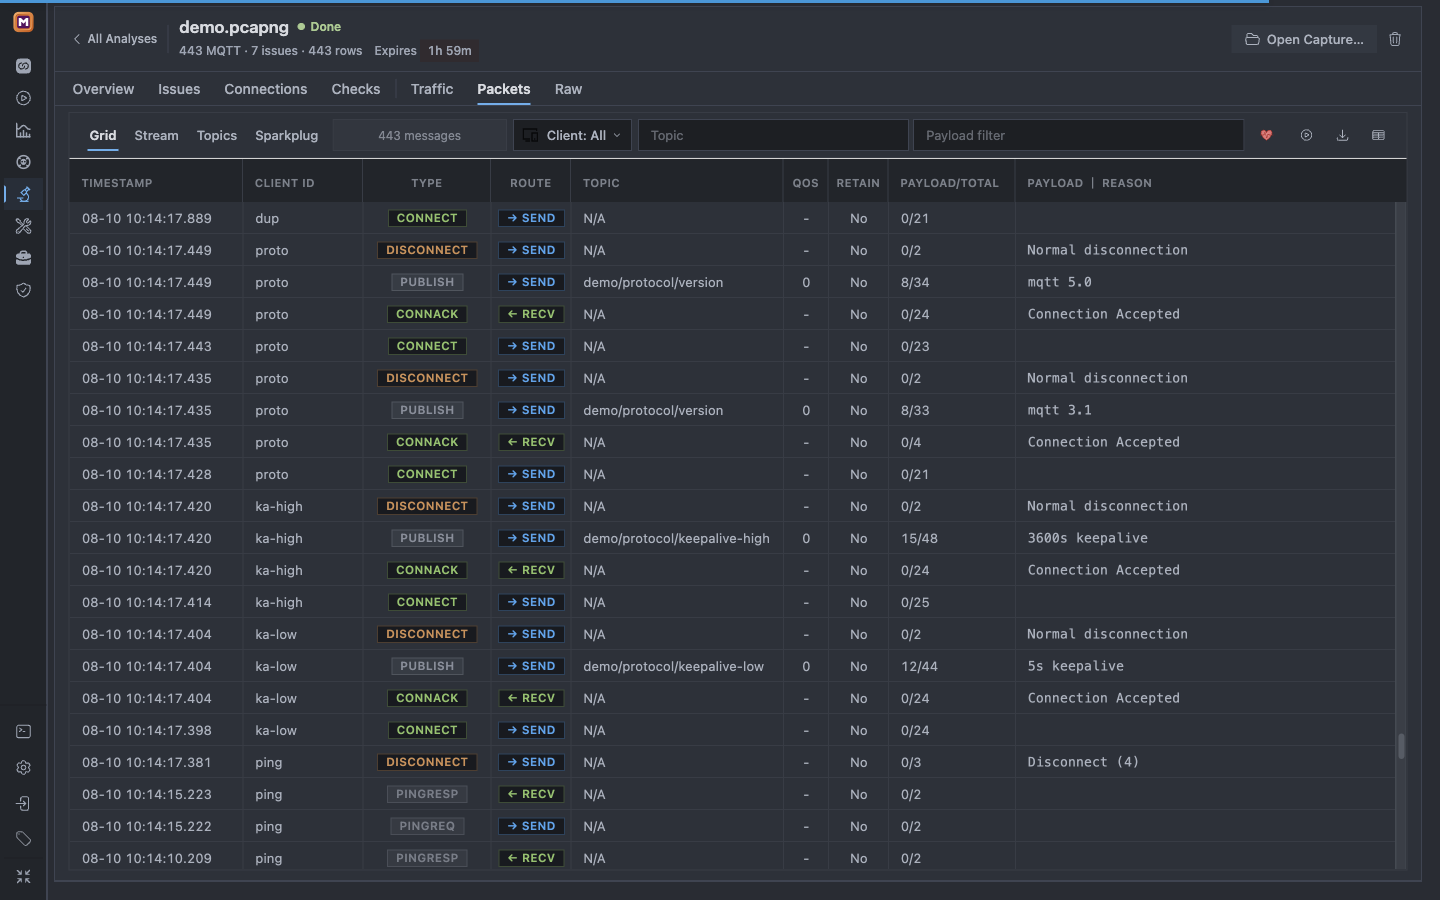
Select Open decoded MQTT packets. Mqttable clears packet filters, selects evidence packet IDs 92 and 96, and positions the grid on the first selected packet. It does not open Message Details automatically.
The deep link retains both evidence IDs and positions the grid on the first CONNECT before you inspect its fields.
1The grid is positioned on the first selected CONNECT for client dup.
2Nearby direction and timestamp rows preserve the captured sequence.
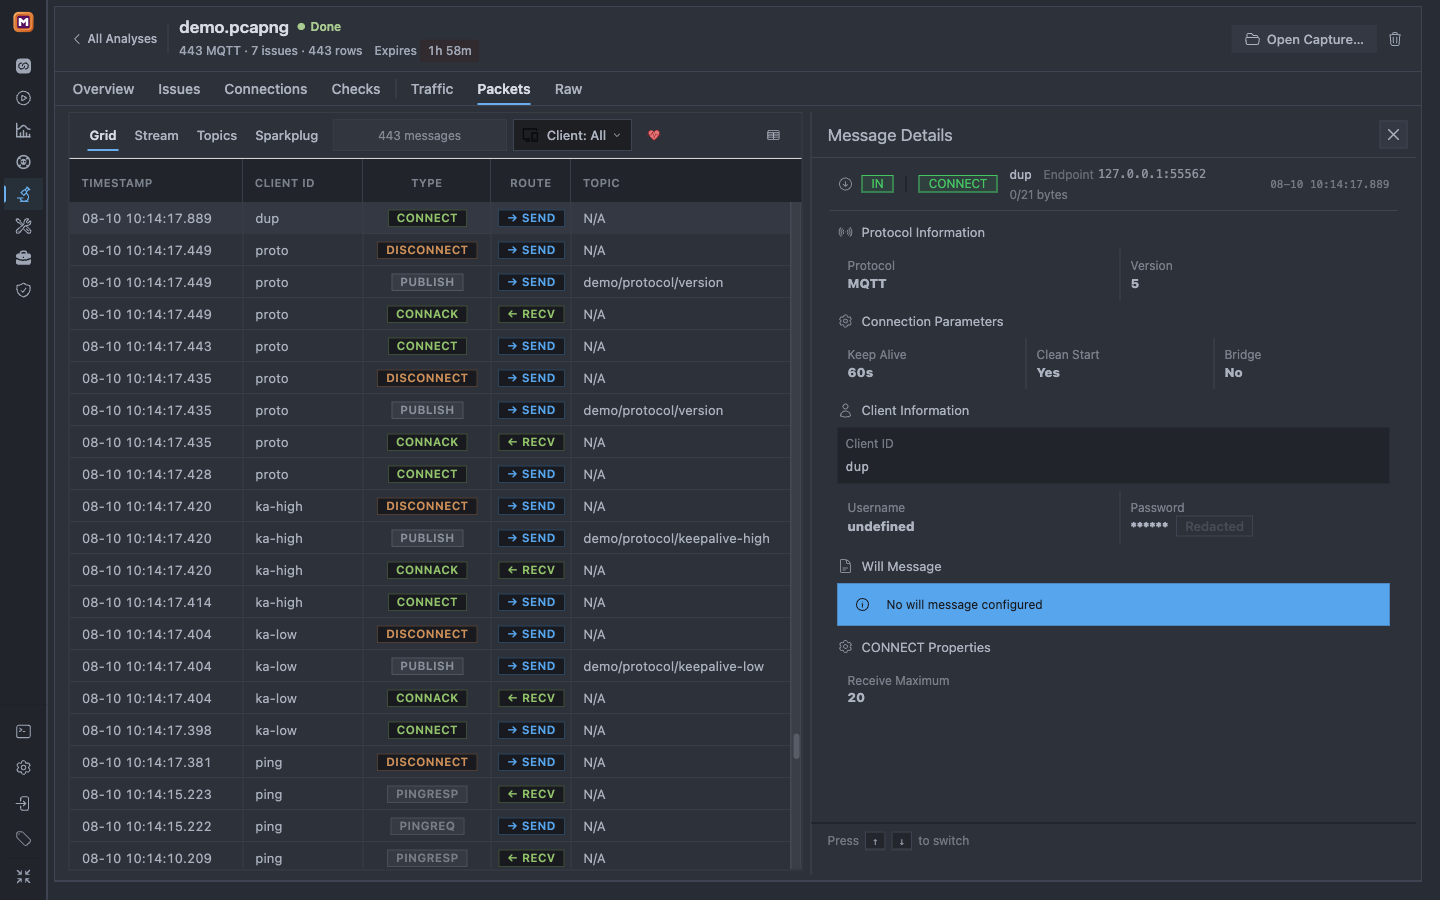
3Click a highlighted CONNECT row to open Message Details.
Click the highlighted CONNECT at 08-10 10:14:17.889. Verify Endpoint 127.0.0.1:55562, MQTT version 5, Keep Alive 60s, Clean Start Yes, Client ID dup, and a redacted password.
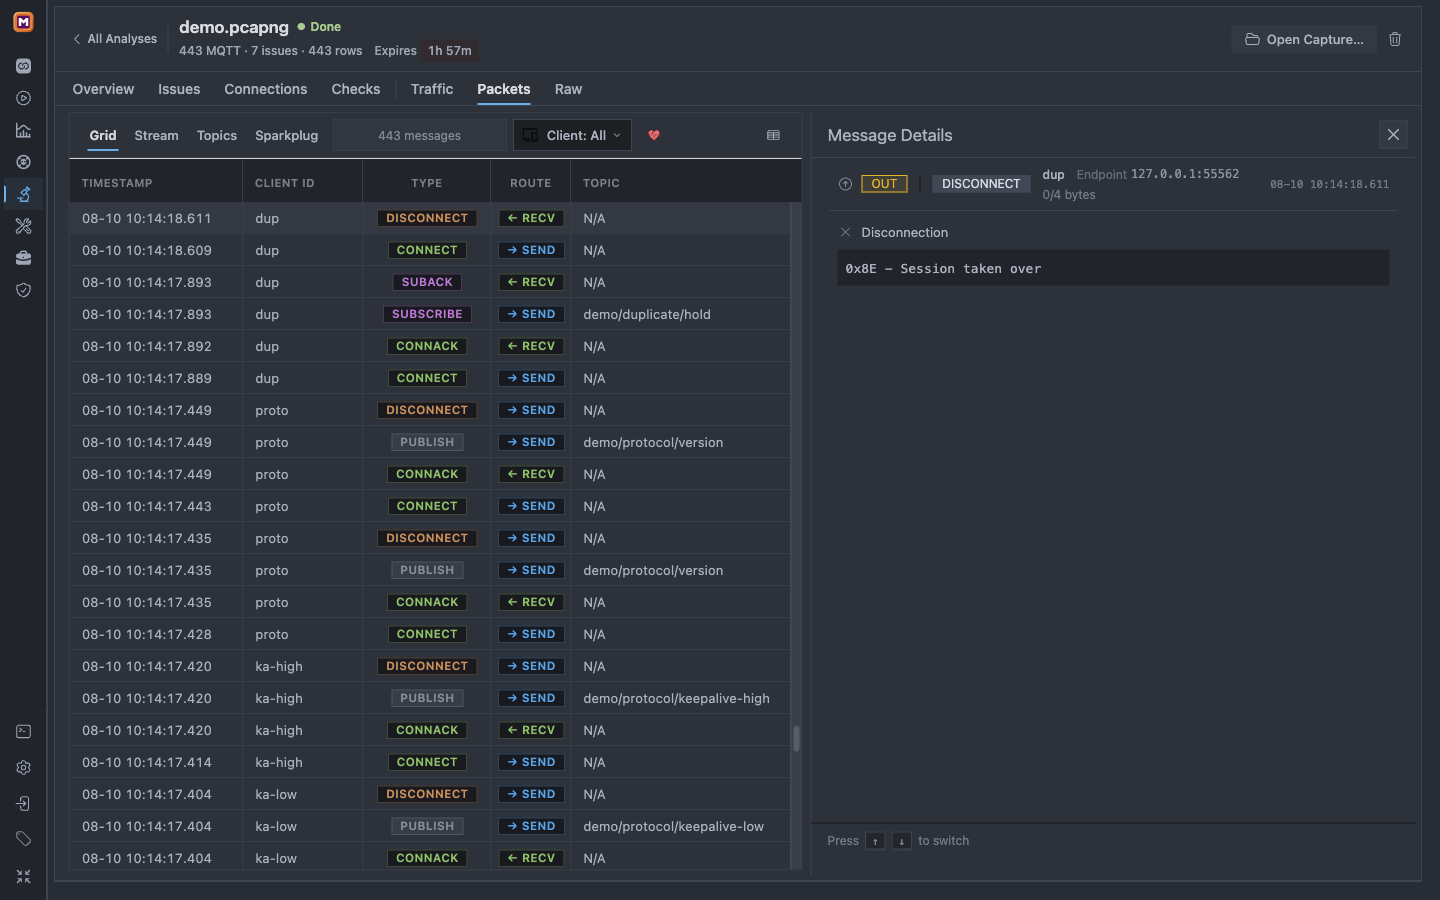
The decoded DISCONNECT reason is the second direct observation supporting the bounded assessment.
1The deep link focuses the DISCONNECT evidence for client dup.
2The row direction shows the packet was received from the Broker side.
3Message Details decodes 0x8E as Session taken over.
Audit the diagnostic check
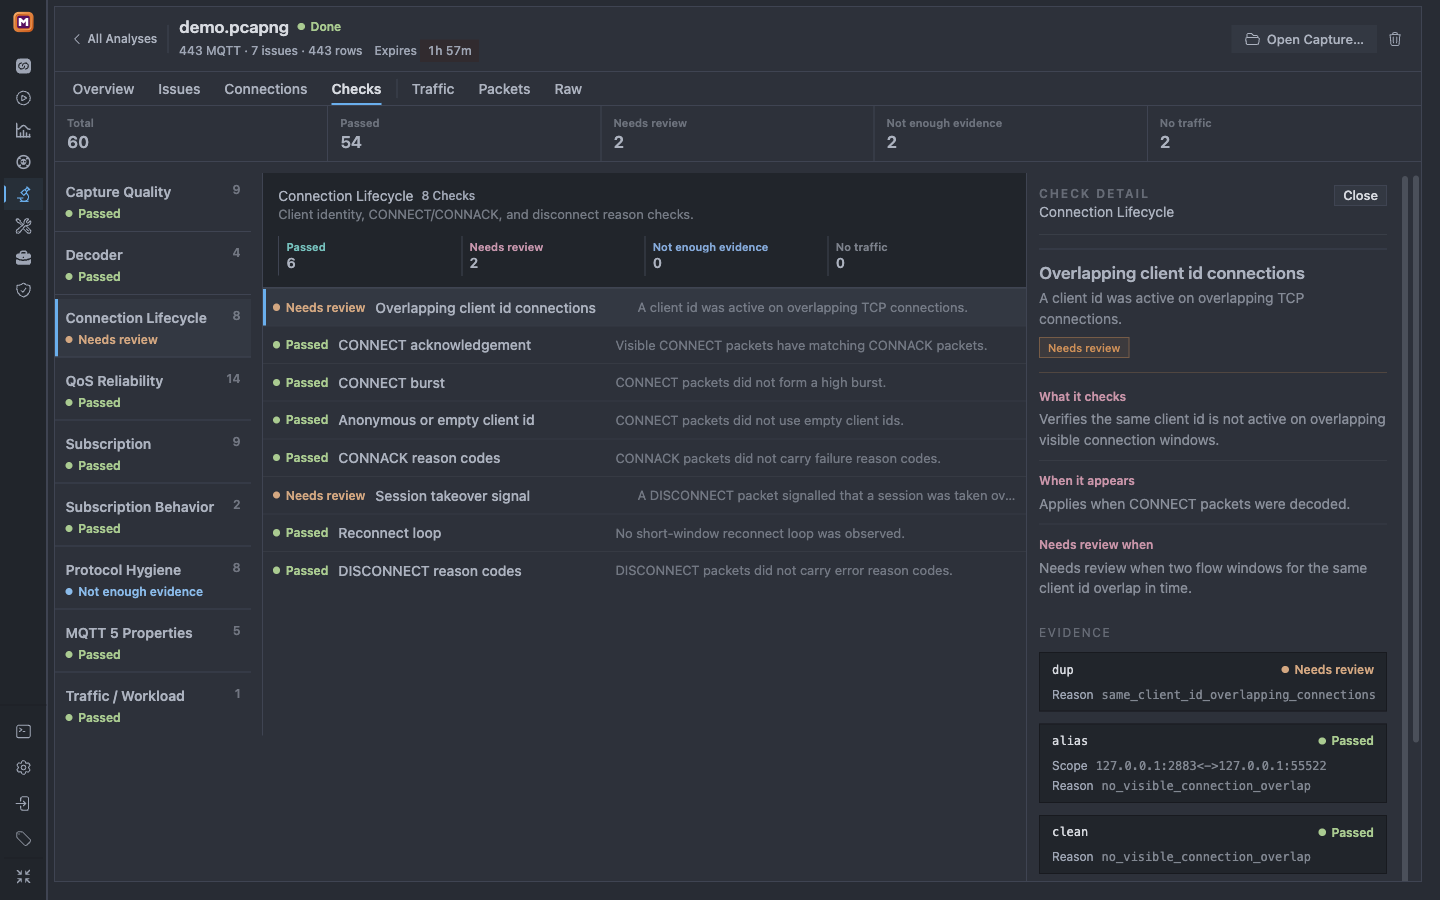
From the overlapping-client issue, select Related checks, then open Overlapping client id connections. The Demo exposes all 60 check details even on Free.
Mqttable keeps the rule, trigger, evidence outcome, and contrasting passed clients visible together.
1Coverage preserves 54 passed, 2 need review, 2 lack evidence, and 2 have no traffic.
2The detail explains what the rule checks and when overlap needs review.
3The Evidence list shows dup as Needs review and visible comparison clients as Passed.
This is the practical difference from a plain packet list: Mqttable evaluates capture trust, groups repeated anomalies, explains each check's evidence boundary, and links conclusions back to decoded packets. It does not replace application logs, Broker-internal diagnostics, or a general-purpose packet analyzer.
Write a bounded conclusion
Direct observation: Client ID dup sent CONNECT on two TCP connections whose visible windows overlap. A visible DISCONNECT carries reason 0x8E / 142, Session taken over.
Bounded assessment: The observations are consistent with MQTT session takeover caused by Client ID reuse.
Still to verify: The PCAP cannot identify which processes, replicas, configuration files, or reconnect paths reused dup. Check Client ID generation, application logs, deployment inventory, and Broker logs next.
Do not shorten this to “PCAP proved the unique root cause.” A capture proves what was visible at its collection point and time window, not application processing or every Broker-internal event.
Analyze your own capture safely
After the Demo, Open Capture… accepts one .pcap, .pcapng, or .cap, or a .zip containing a supported capture. The UI limit is 50 MB, including the extracted capture inside a ZIP.
Record authorization, capture host, interface, direction, time zone and window, filter, snap length, and known loss or truncation.
Use an approved copy. A capture can contain plaintext credentials, Client IDs, Topics, and Payloads. UI redaction does not sanitize the source file, exports, or screenshots.
Confirm the Runtime. Local Runtime analyzes on this computer. Remote Runtime receives and analyzes the upload remotely and requires current online Pro, sign-in, and pcap:upload and pcap:analyze permissions. Stop on Locked or permission errors; there is no automatic Local fallback.
Read Capture Confidence first. TLS, one-way traffic, TCP gaps, truncation, or a mid-session start can produce Not enough evidence; that is not Passed.
PCAP capabilities and limits in Free and Pro.
Capability
Free
Pro
Previous PCAP analyses
Up to 3
Unlimited
Your capture's check details
Full summary and top 5 diagnostic details
Every diagnostic detail
Built-in Demo
Complete Demo diagnostic surface
Complete Demo diagnostic surface
Runtime
Local Runtime
Local and authenticated Remote Runtime after online confirmation
Delete the Demo analysis
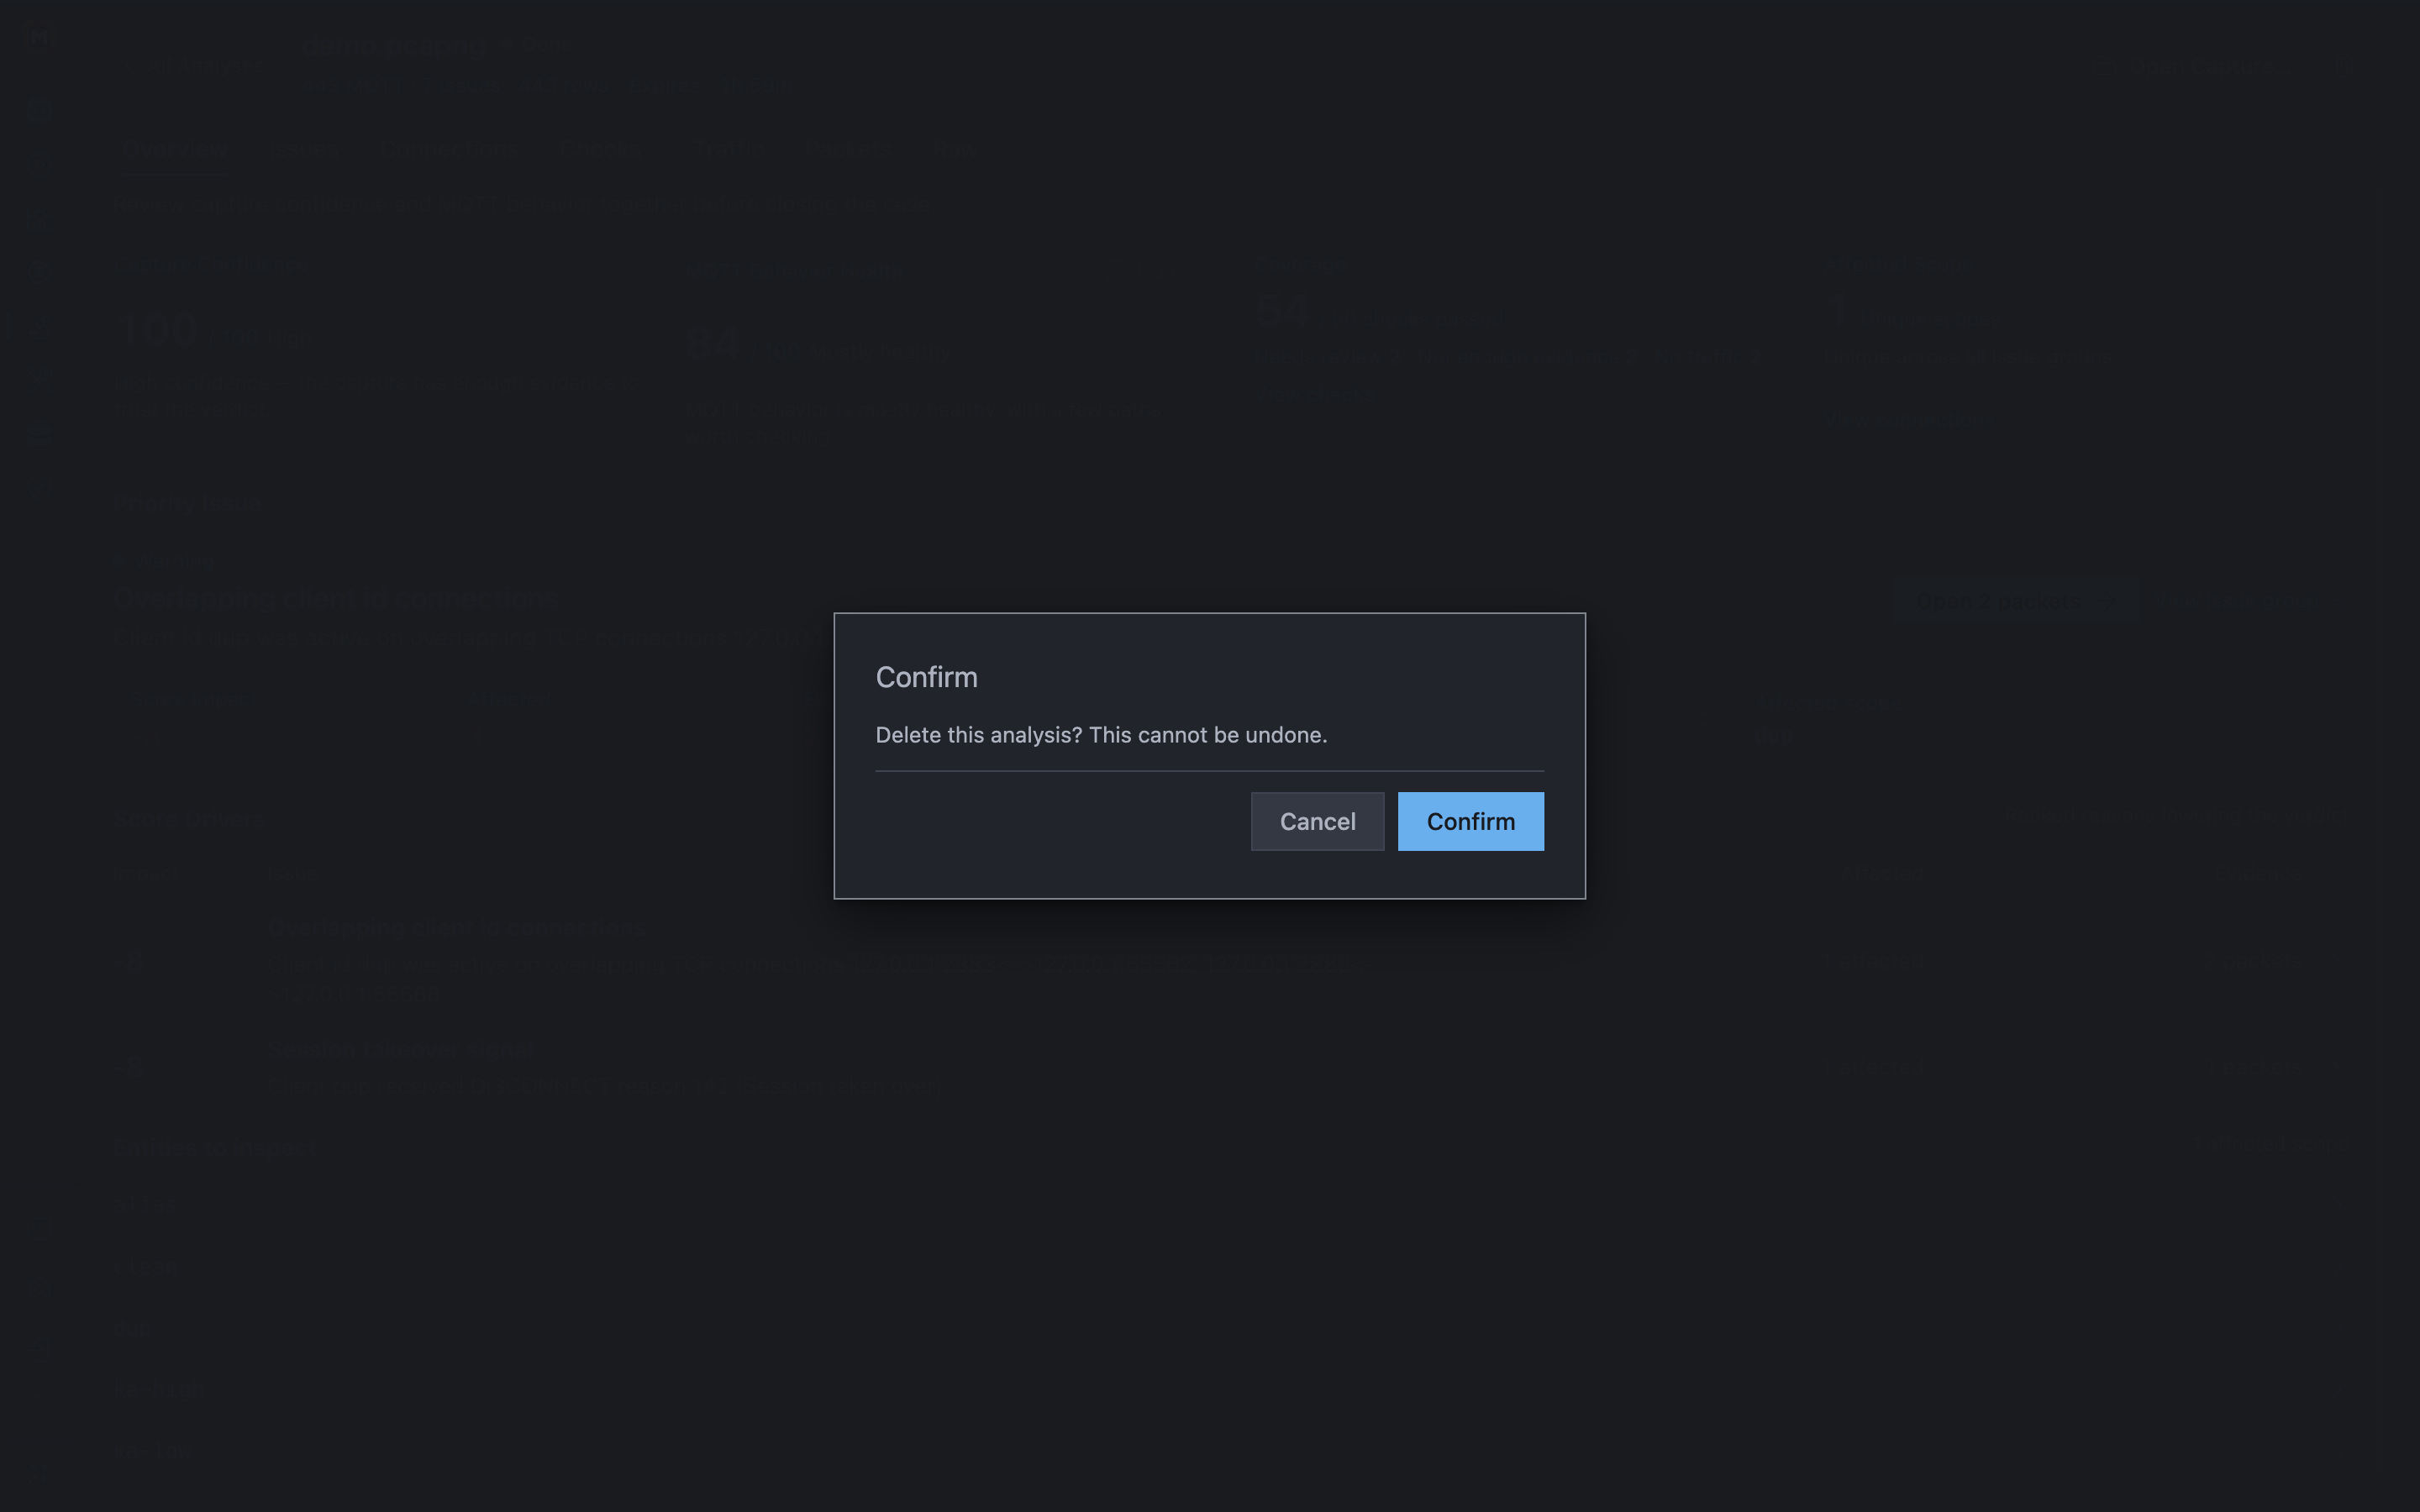
The Runtime keeps an analysis for about two hours by default. Confirm the current analysis is demo.pcapng, select its trash action, read Delete this analysis? This cannot be undone., then select Confirm.